
Momentum Runs are not perpetual. At some point Professional Technical Traders who are one of several drivers behind Momentum Runs, will take profits at technical resistance levels.
Understanding whether the Price action is simply profit taking by Professionals or a sudden reversal of trend, is critical to successful Swing Trading. Often times Retail Swing Traders make the mistake of using a “Stop and Reverse Strategy” SARS, with disastrous results during a Momentum Market Condition.
The key analytical elements rest with the Relational Analysis™ between what Price does during profit taking, and how Volume and Quantity Indicators are behaving. Are the Volume and Quantity Indicators confirming, or are they contrarian to the Price action?
The chart example below of Douglas Emmett Inc. (DEI: NYSE) is an excellent example of why so many Swing Traders using Stop and Reverse Strategies which focus solely on Price action, have problems and whipsaw trades that go against them.
Those of you who read my articles regularly will see that the template has a different look, as my company TechniTrader® has now built a set of tools in StockCharts.
The chart shows a Momentum Style Run out of a “Basing Bottom.” This formation is one of many new bottoming types that have started showing up over the past couple of years. It is because the Dark Pool venues have increased activity off the exchanges, with new order types that allow for new controls on entries for giant lot activity by the giant Institutions.
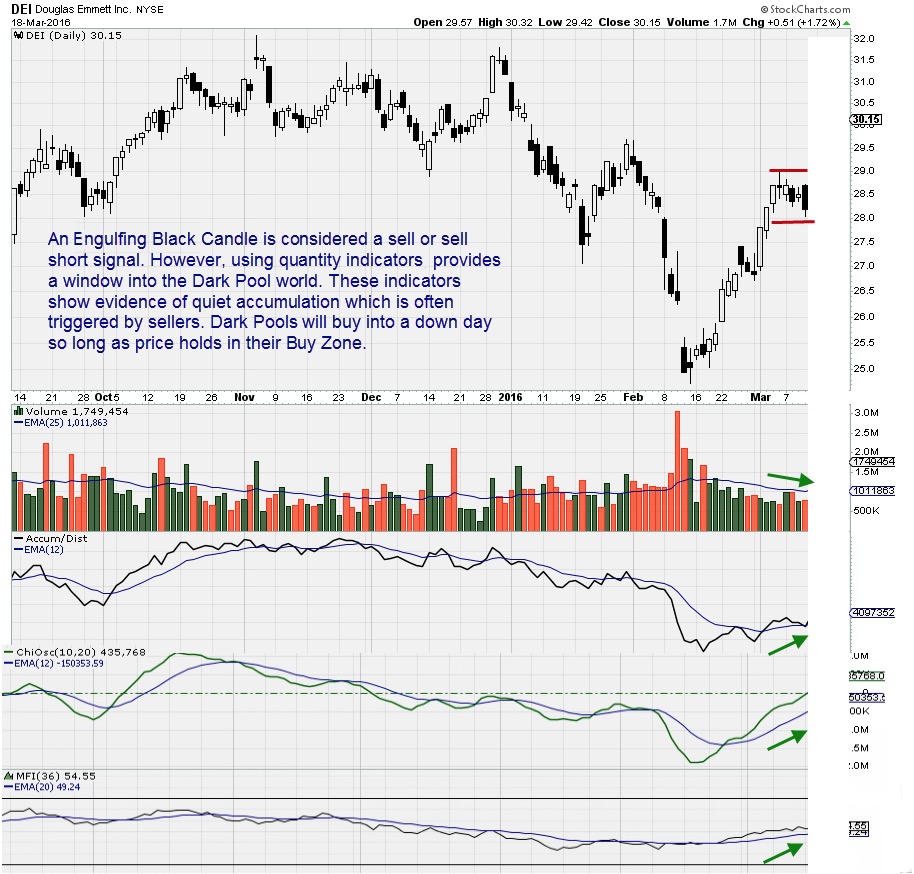
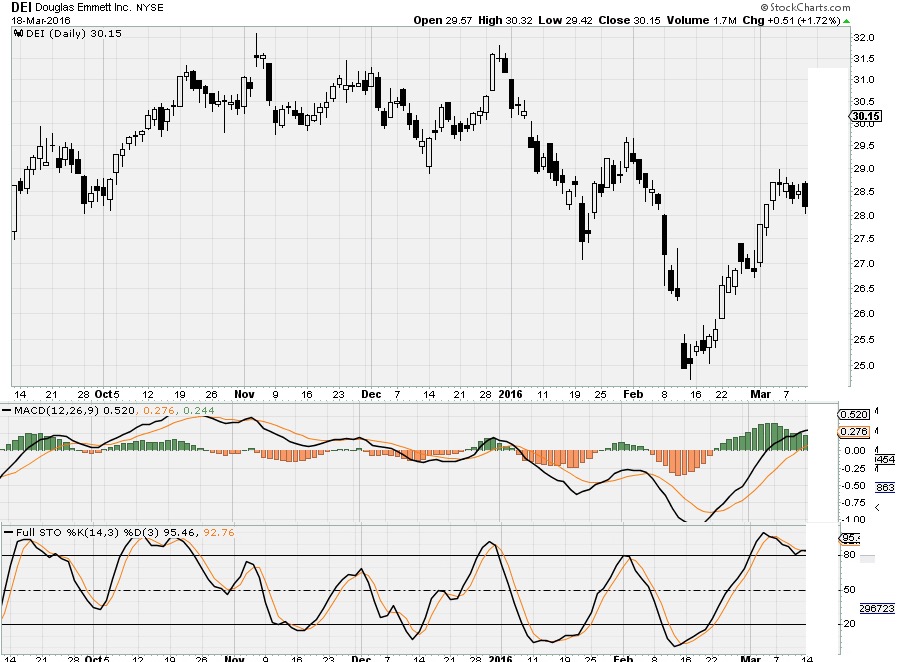
The majority of indicators that are popular now are Price and Time Indicators. Just using them for direction indication on the last day shown on the chart, it really looks like the stock is poised for far more than just profit taking. It appears that the Engulfing Black Candlestick is a sell signal or Sell Short signal. The expectation of Technical Traders who only use Price and Time Indicators, would be that this stock is going down.
Advanced and Experienced Traders should recognize that MACD is showing an extreme upside pattern. Since you all know this indicator lags, this big black candle looks to be negative given how MACD looks. Stochastic is another highly popular Price and Time Indicator. It had an extreme spike and now is crossing down, as a signal to potentially Sell Short or use SARS. Both Price and Time Indicators by themselves are indicating to a SARS Trader, that it is time to Sell Short.
Now instead let’s use the indicators of Volume, Accum/Dist, the Volume Oscillator CHiO, and Money Flow Index MFI for the same stock.
The chart picture is totally different when you add the critical third element of data that comes from the market, which is Quantity.
The 4 Quantity Indicators all show Quiet Accumulation by the giant Institutions, even as the stock sold off that day. So as profit takers sold and others started Selling Short, giant Institutions were buying giant lots. This is crucial information for Swing Traders. Volume is in a resting phase pattern, and Accum/Dist is ticking up. The
Volume Oscillator CHiO was still rising toward the center line where it oscillates, and Money Flow Index MFI is angling upward rather than down.
What Quantity Indicators add to analysis is enormous. It makes a huge difference in decisions that impact Return
On Investment ROI, and overall income.
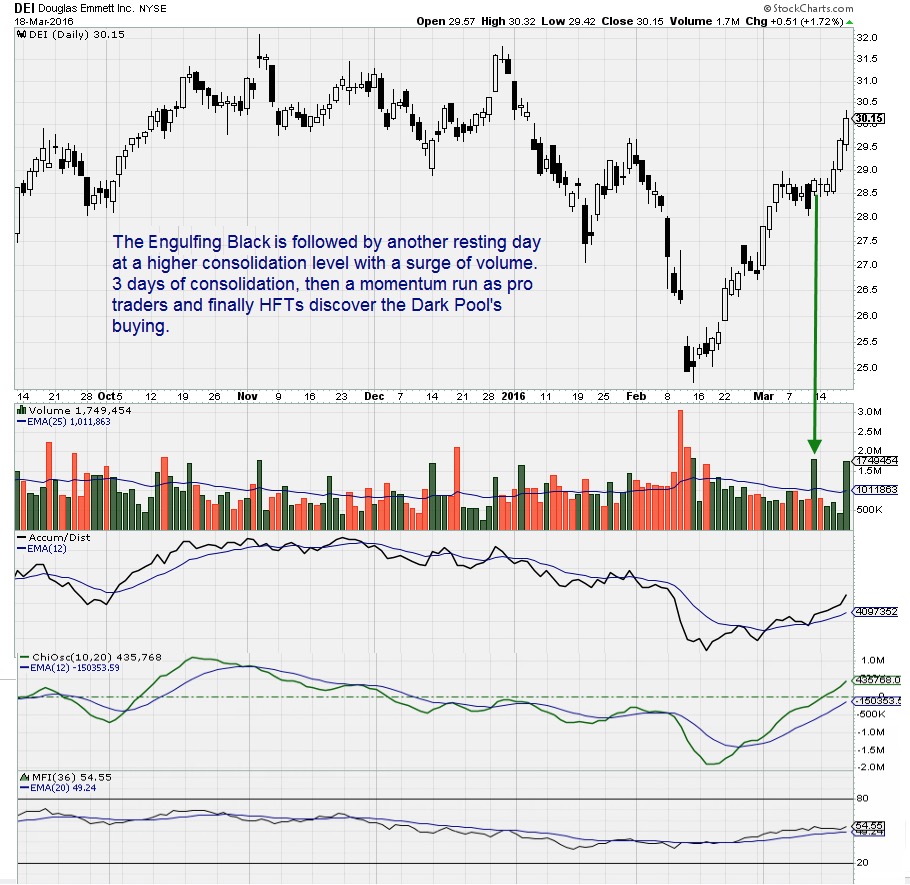
Summary
The final chart example of DEI shows that the stock was merely resting, before another Momentum Run.
Price and Time Indicators by themselves are not enough anymore. Sure, Price used to be the most important indicator. However in the past 5 years all that has changed, due to the fact that the use of Dark Pool venues has gone from 5% to 18% by the giant Institutions, and is still rising.
Without Quantity Indicators and understanding how to use and apply them, Traders are simply guessing rather than analyzing.
Trade Wisely,
Martha Stokes CMT
www.TechniTrader.com
info@technitrader.com