Please refer to these two articles titled:
1. "Is it Time to Look at Corn Futures and Related ETFs?" posted on StockCharts.com April 2, 2020
2. "Corn Market Part II: Updated Chart and Pattern" posted on StockCharts.com April 16, 2020
Note: None of the markets, ETFs or stocks listed in this article are recommendations to buy or sell; this article is intended for educational purposes only.
In the first article in this series on the topic of the corn market, there was a pattern discussed called the "Butterfly buy pattern." This pattern achieved only a small corrective move to the upside and then failed with a large move down. It is worth noting these patterns, when failed, tend to have larger moves in the opposite direction of the anticipated move.
The original analysis identified a potential area of support just around the 305 area if prices moved lower. Price has reached that level, marked with the pink horizontal trend line that was drawn in with the first article. See Chart 1 below.
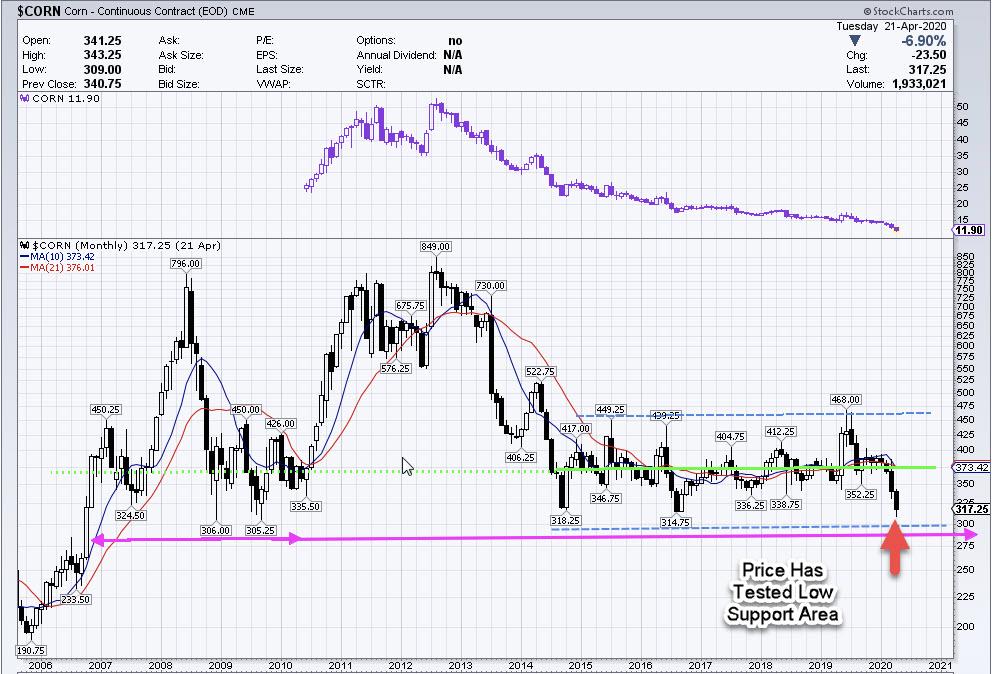
Chart 1 - $CORN Continuous Contract Monthly
As of today, price has bounced from this level and rallied. The question is if this is a sustainable rally. Let's take a look at Chart 2, an intraday 60 minute chart that we have been following with this analysis.

Chart 2 - Corn Futures Continuous Contract 60 Minute
The downward trend line has held the last rallies. A break above this trend line may give a signal the market is ready for a stronger rally to the upside.
Notice also the light blue lines drawn on the last 2 corrective rallies, which are very similar in length. Something traders can look for is upon a strong break above the trend line, a rally measuring longer than the previous 2 rallies noted in the blue lines.
Also on this chart is an AB=CD sell pattern. If there is a failure of this pattern, if it does not reach a deep retracement or new lows and a break above the trendline, that can also be a signal the market is ready for a larger rally to the upside. Keep an eye on that trendline if you are following this analysis.
It's always important to learn entry skills, which include combining elements of intraday timeframes, momentum indicators and other price patterns to control risk, as well as, at times, waiting on the sideline until there is confirmation.
There are trading techniques that can be learned and implemented to control risk and monitor the price behavior. We never know what price will do - the only element we can control is the risk.
If you would like to learn more about these patterns and programs to learn to trade them please visit me at my website www.tradingliveonline.com or feel free to email me at ljouflas@msn.com.
Best wishes for successful trading!
Leslie Jouflas, CMT