Please reference the first part of this article titled, "Potential AB=CD Sell Pattern SP 500 Emini Index", originally posted April 14, 2020 on StockCharts.com.
Note: None of the markets, ETFs or stocks listed in this article are recommendations to buy or sell, this article is intended for educational purposes only.
Since that article was posted, the S&P 500 Emini, NASDAQ and DJIA have all had a minimum retracement of .382 using the low of the C leg from the sell pattern. This means there is potential for further retracement using the low of the A point of the pattern.
Chart 1 of the SP 500 Emini shows the retracement from the March 2020 lows at point A as not reaching the .382 retracement as of yet. We never know what price will do, but we can look at expectations based on particular patterns and monitor price accordingly.
With the steep downtrend that began in late February, the expectation for this pattern is a minimum retracement to the .382 using the A point and potential deeper retracements testing into the .50 to .618 areas.
Chart 2 shows an example with the NASDAQ and the retracement from the low of the C point, reaching the .382 of that retracement, but, using the March lows and the A point, a minimum retracement or deeper has not been reached yet.
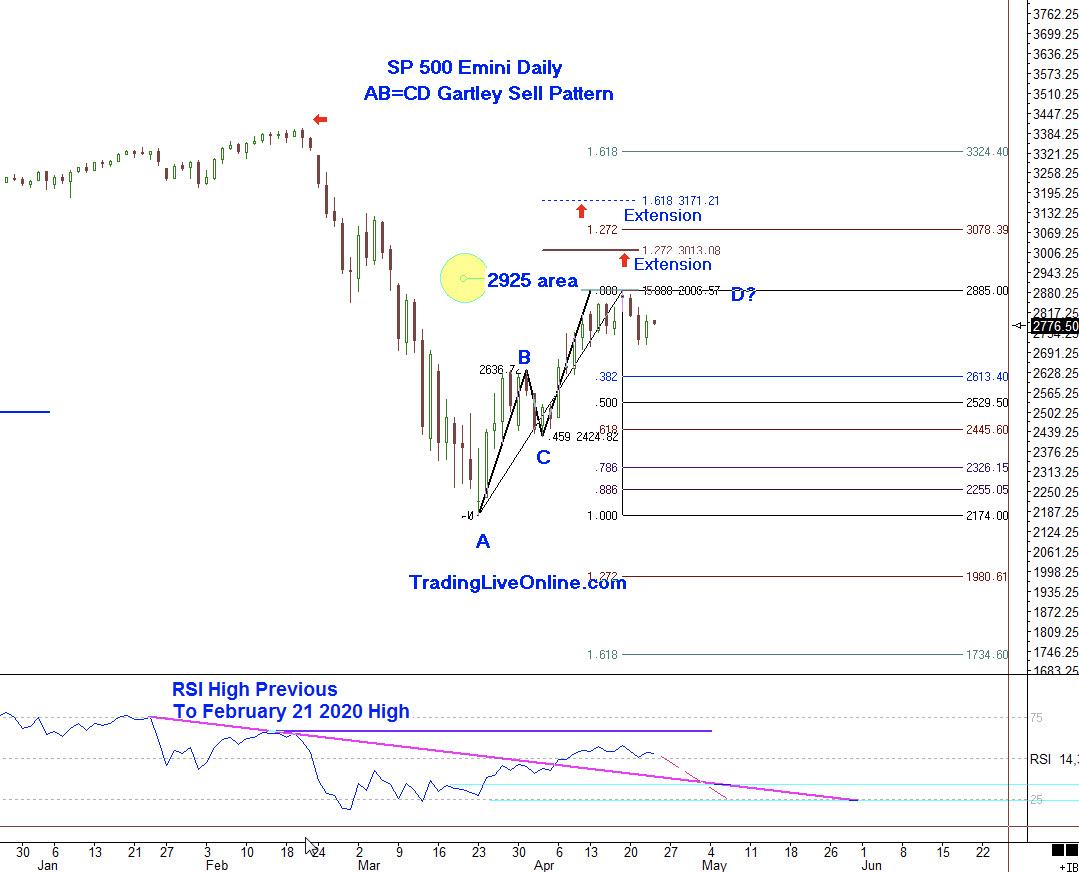
Chart 1 - Showing Retracement From the A Point, March 2020 Lows
Chart 2 shows the NASDAQ and the retracement from the low of the C point and reaching the .382 of that retracement, but, using the March lows and the A point, a minimum retracement or deeper has not been reached yet.

Chart 2 - NASDAQ Showing .382 Retracement Using the A Point, March 2020 Lows
Both charts have an RSI indicator and a few trendlines to monitor with price. Let's take a look at Chart 1 again and the RSI.
Along with the horizontal trendline, there is a pink downward-sloping trendline intersecting with 2 horizontal blue trendlines. This trendline has had a penetration to the upside, but has not exceeded the horizontal trendline. The divergences that formed at the March 2020 lows may be areas that the RSI will test. Connie Brown has done very good work with RSI and these types of principles. In her book Technical Analysis for the Trading Professional, she explains shifts of RSI ranges from bullish to bearish and bearish to bullish very well.
The RSI, shown in Chart 1 as an example, has not breached the upper horizontal trend line. However, a scenario to monitor is a test of the RSI down to the 35-40 area, holding, a move back up with price and a break of the upper trendline would be a bullish signal.
I've drawn in a dashed red line to illustrate the possible movement of the RSI, testing and holding a lower bullish reading near the level of the RSI when the bullish divergences formed prior to this rally. I will be monitoring this and will update this article if there are new developments.
Also worth mentioning and monitoring is in the event that price moves to the upside above the recent highs. There are still areas of resistance and pattern levels at this point that were discussed in the first part of this article at the extension areas. If this were to occur, I would also update this article.
For now, we will watch and see if the market can continue to some deeper retracement levels.
It's always important to learn entry skills, which include combining elements of intraday time frames, momentum indicators and other price patterns to control risk and also, at times, waiting on the sideline until there is confirmation.
There are trading techniques that can be learned and implemented to control risk and monitor the price behavior. We never know what price will do; the only element we can control is the risk.
If you would like to learn more about these patterns and programs to learn to trade them please visit me at my website www.tradingliveonline.com or feel free to email me at ljouflas@msn.com.
Best wishes for successful trading!
Leslie Jouflas, CMT