On January 11, 2022, I presented a segment for StockCharts TV's Your Daily Five show titled "Are Market Indexes Hinting at Long-Term Weakness?".
The week of April 18, 2022 to April 22, 2022 saw prices in all indexes trending down for 2 days. It's unusual for the markets to have multiple trending days back-to-back. This generally signals a change. However, I believe this signal is only one of several that have occurred since the start of 2022.
Let's start by looking at Chart 1, a monthly chart of $SPX.
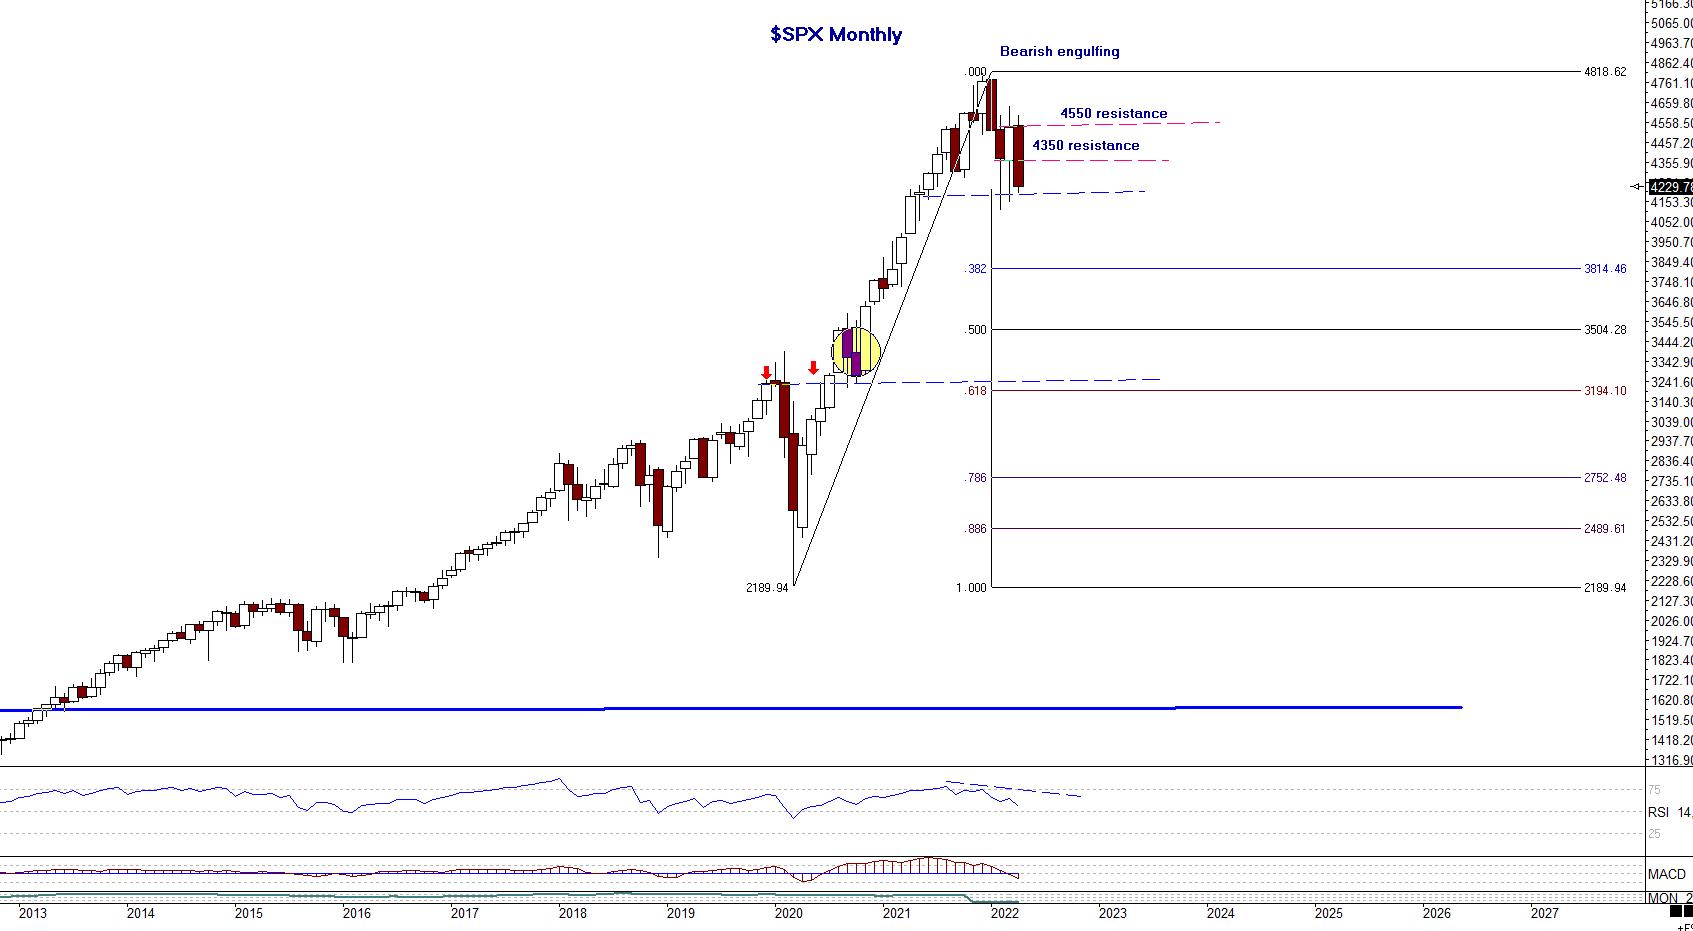 Chart 1
The January 2022 closing bar formed a bearish engulfing pattern. The close of this pattern erased most profits of investors from November and December 2021.
The February and March 2022 bars, interestingly, have opens and closes virtually in the same price ranges. These are illustrated on the chart with the upper red dashed line (4550 resistance) and lower blue dashed line (4350 resistance). The reason the lower blue dashed line is marked resistance is because it had previously been support. Generally, once support is broken, it will then act as a potential resistance level. Note also the pink dashed line where 4350 resistance is labeled. This is approximately a 50% retracement of the current monthly candle (April 2022), which still has a few more trading days before closing and a potential resistance level on any rally to the upside.
The lower, dashed horizontal trend line, 4200 price level, should be monitored for any potential downside breaks. We'll look in detail on a weekly (Chart 2) and daily chart (Chart 3) at this important price level.
Chart 1 of the $SPX monthly also shows Fibonacci retracement levels using March 2020 lows. The yellow circle near the .618 and red arrows are showing the price level from the upside breakout above the highs preceding the March 2020 highs.
Chart 2 of $SPX is a weekly chart showing detail of a potential Head-and-Shoulders pattern. In technical analysis, Head-and-Shoulder patterns are only validated with a break of the lower neckline for a topping pattern and a break of the upper neckline on an inverse, bottoming pattern.
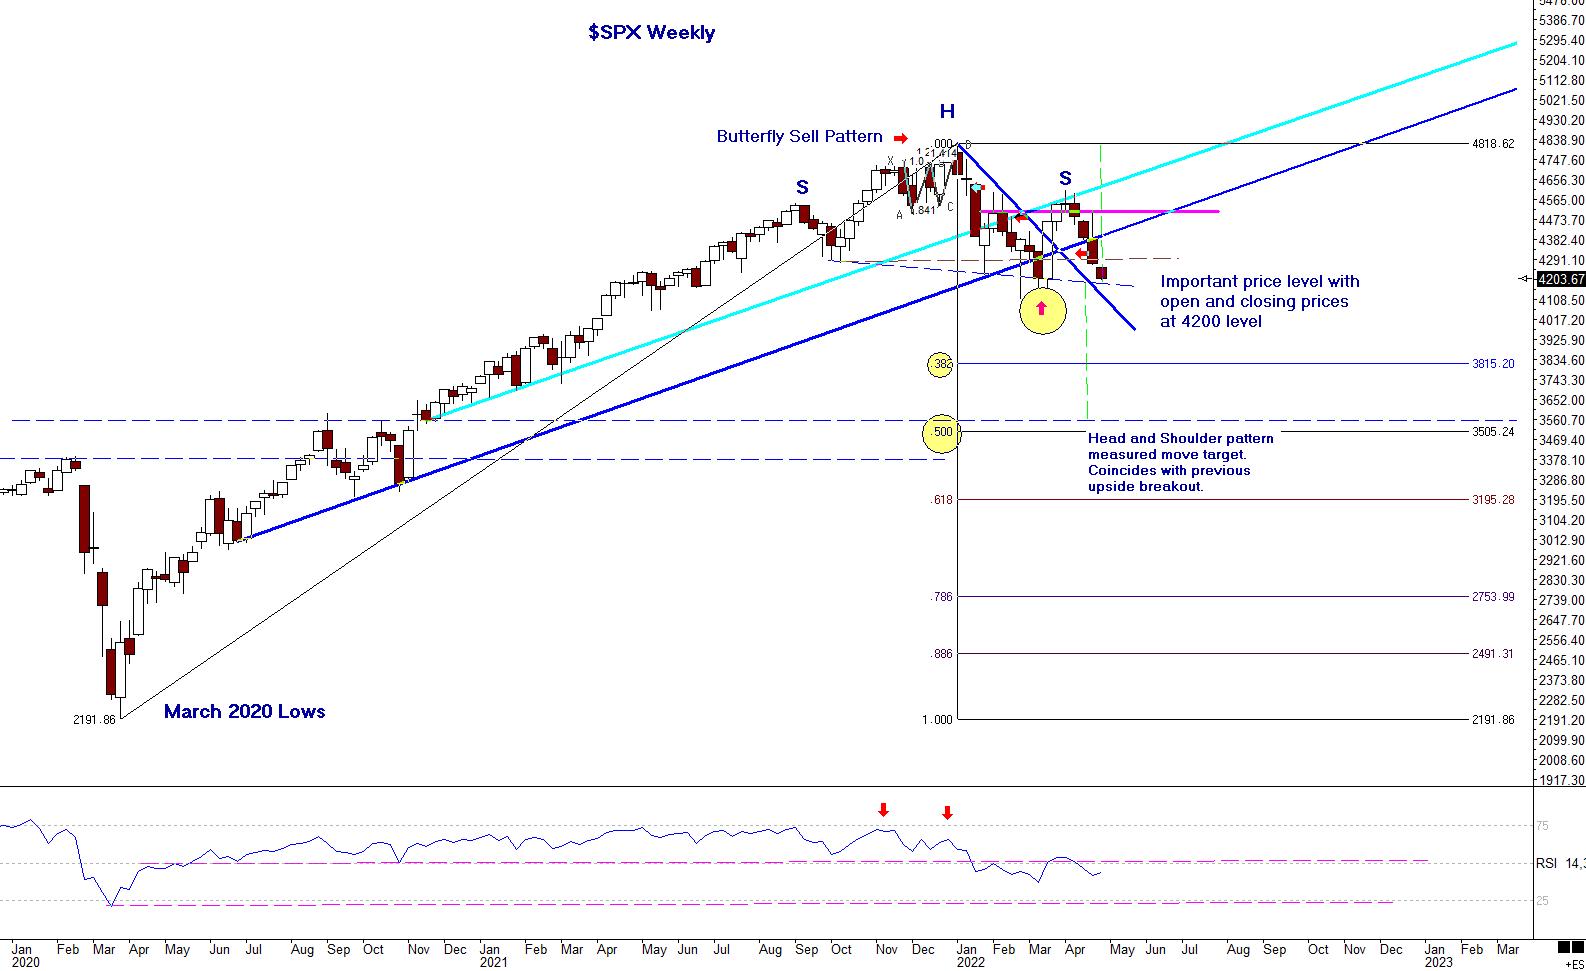 Chart 2
Viewing Chart 2, we can see more detail using trendlines and outlining of the Head-and-Shoulder pattern. Let's walk through some of the price levels.
The all-time highs in January 2022 completed a Butterfly sell pattern. This pattern was discussed in the video link above, and this pattern was followed on my website for subscribers. The right shoulder shows a horizontal pink line; this price level, around 4525 to 4550, shows opening and closing prices around the same price level, 4525, and the highs of those bars at 4550 level. The high of the right shoulder is a test of an upward-sloping trend line, which broke (light blue), and an evening star candlestick pattern, re-test of the trend line. That appears to have completed the right shoulder of the pattern. Using the lows of the left shoulder, a horizontal neckline is extended to the right, near the intersecting trendlines at red arrow. If this is "the" neckline, then it has been penetrated and the pattern is activated. However, there may be a neckline that is downward-sloping and the lower end is being tested today, around the 4200-price level. The market needs to close below this level to confirm the pattern.
If the 4200 level is decisively broken, then we can look for potential targets to the downside. The weekly chart shows potential areas. There are Fibonacci retracement levels using the March 2020 lows. As a note, the NASDAQ and QQQs traded to the .382 retracements in March 2022, and the $SPX and Dow Jones Industrials did not reach these retracements. The technology sector was much weaker on that sell-off.
Please see my April 12, 2022 Your Daily Five segment, titled "Tech Giants on Watch", that details current patterns in GOOGL, AMAT, AAPL, MSFT, FB, and AMZN. Most of these broke the support levels outlined in that segment.
The tech sector (NASDAQ, QQQ) will exceed the .382 retracement level reached in March 2022 and may well lead the $SPX and $INDU to lower levels. Monitoring this Head-and-Shoulder pattern should give traders a good roadmap to follow.
Finally, prior to the neckline/neckline's being decisively broken, if a rally exceeded a trend line drawn from the high through the high of the right shoulder, that would likely invalidate this pattern, and possible call for a reversal to the upside.
Best wishes for successful trading!
Leslie Jouflas, CMT
Note: None of the markets, ETFs or stocks listed in this article are recommendations to buy or sell; this article is intended for educational purposes only.
Please refer to my book Trade What You See, How to Profit from Pattern Recognition for more information. It's always important to learn entry skills, which include combining elements of intraday time frames, momentum indicators and other price patterns to control risk, and also, at times, waiting on the sideline until there is confirmation. There are trading techniques that can be learned and implemented to control risk and monitor the price behavior. We never know what price will do, and the only element we can control is the risk.
If you would like to learn more about these patterns and programs, please visit me at my website www.tradingliveonline.com. Questions? Email ljouflas@msn.com.