There is little in this world that irks me more than listening to a fundamentalist eschew technical analysis. I have a somewhat unique background as a Technical Analyst, having passed the CPA exam some 30 years ago and having spent 20 years in public accounting. That has provided me a solid fundamental background when it comes to evaluating companies. But I've also had an uncontrollable passion for technical analysis since the first time I uttered those two words - Wall Street. I can see the role both sides play in an investor's/trader's strategy and really don't have a problem with anyone's strategy whether it be short-term trading or long-term investing. We're all wired differently so by all means choose the strategy that works the best for you. Just don't belittle my technical analysis by showing - perhaps in the words of Alan Greenspan - your irrational ignorance.
Grrrrrrrrrrrrrrrrrrrrrrrrrrrrrrrrrrrr.
Don't you dare take away my charts. I need my candlesticks. And the MACD? Puh-leazzzzzzzzzze. If Patrick Henry were with me right now, he'd say "Give me Fibonacci or give me breadth"!
If you're a fundamentalist, please understand the difference between looking for a guarantee and looking to manage risk. I use technical analysis for the latter and I'm assuming everyone else does too. If you're using it to provide guarantees, you might want to change sports. There are no guarantees in the stock market. Through my years studying stock market price action, I've only made one guarantee - that I will many times be wrong. Technical analysis isn't about being right or wrong. It's about MANAGING RISK.
Let me give you a couple examples. First, I wrote an article recently titled "Shorting Candidates Over The Weaker Summer Months". I'm going to use one of the charts from that article to illustrate my point here, but you can read the article in its entirety by CLICKING HERE. Healthcare stocks have been on a roll, widely outperforming the remaining eight sectors. The healthcare ETF (XLV) is up more than 25% over the last year, swamping the S&P 500. But there are warning signs and storm clouds brewing on the horizon for this sector. One healthcare stock that looks to have reversed its uptrend is Spectranetics (SPNC). It had been rolling along in a very nice uptrend, but recently tumbled on massive volume, losing price, moving average and trendline support in the process. In technical analysis parlance, SPNC is broken. Take a look at the chart:
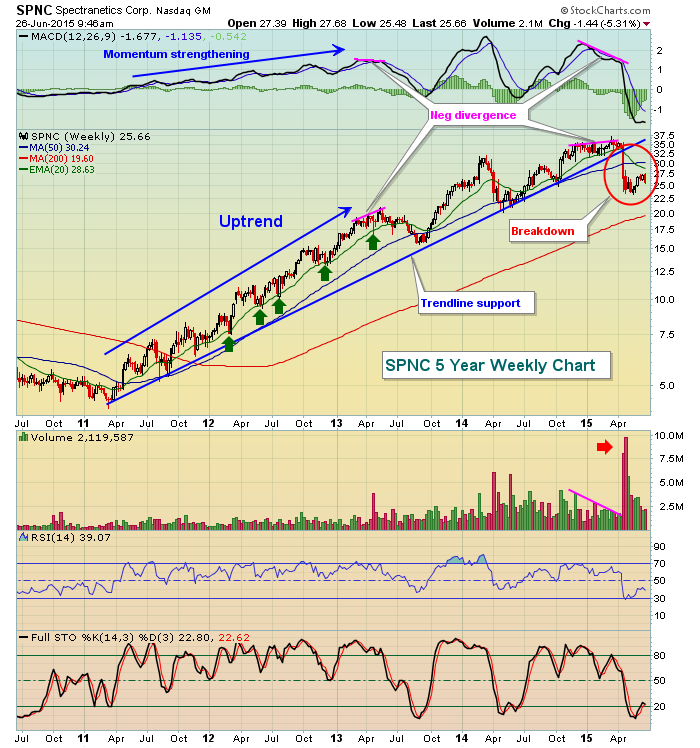
I could write about this chart for hours, but I'll try to contain myself and simply mention a few key points about how I try to manage my risk. Here are a few points:
(1) Note the very strong uptrend from early 2011 to early 2013. When the MACD continues pushing higher with each price high, one of my favorite trading strategies is to buy on pullbacks to test the rising 20 period EMA, in this case the 20 week EMA. The green arrows highlight the successes of this strategy over that two year period.
(2) There are two very obvious times when the MACD turned negative and suggested that momentum to the upside was slowing. Keep in mind I said "suggested". There are no guarantees. These negative divergences do not mean that the price will tumble. It simply tells me that risk is elevated and we could see more selling than just down to rising 20 week EMA support. These negative divergences normally indicate one of two things - either a 50 period test and a MACD centerline "reset" is needed before a further advance OR it indicates we could be nearing a major trend reversal. We don't know which to expect until the action confirms. With the first negative divergence in 2013, we saw a MACD centerline reset and a 50 week SMA test. Then the uptrend resumed. Note the volume wasn't too heavy on the summer selling and trendline support was never violated. Now check out the second reaction to a negative divergence - in 2015. The chart is telling me something completely different. Volume accelerated to the downside, trendline support was lost, the MACD has collapsed well beneath centerline support and this confirms to me that the uptrend has ended and a downtrend has begun. The only reason I wouldn't short SPNC is that I do not short stocks when we're in a bull market. I'd rather be long - not SPNC, but the market in general.
(3) Notice the trendline and how many successful tests of the trendline we see. A trendline is only as strong as the number of price points it connects. A trendline connecting two price lows is dangerous. Three is better, four much better, etc. When you have several and the trendline breaks, you need to take notice.
(4) One final point here. Every time we saw a 20 week EMA test, the RSI fell back close to 50. When the 50 week SMA was tested and the MACD reset, note the RSI dipped close to 40. I LOVE to buy stocks in uptrends with RSI in the 40-50 range. That's an easy way to manage downside risk while at the same time increasing your reward potential. And just about every successful trader I know will tell you that managing your REWARD to RISK is the key element to making money longer-term.
Let me give you one more example....and this time it's a trade I actually made (I did not trade SPNC during the period above - at least not that I remember!). Look at the Nike (NKE) chart:
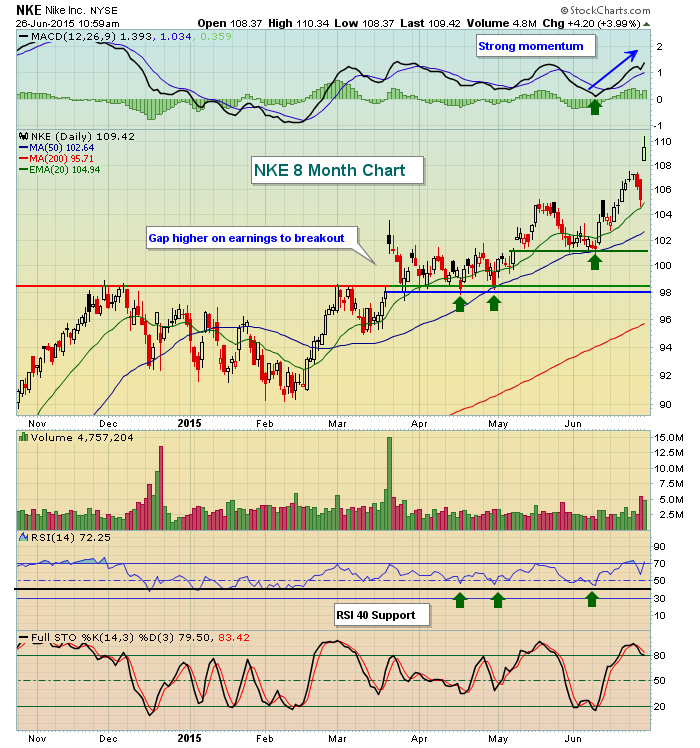
NKE has been in an uptrend for quite awhile. But if you bought in early December or after the gap higher in mid-March, you probably were frustrated for several weeks. Fundamentally, the story's been great for NKE. Technically, however, price action dictates best entry points. Note the periods when RSI has been in the 40s. Three of those periods were highlighted with green arrows. Note that these periods also coincided with gap support, price support and MACD centerline tests. That's the beauty of technical analysis - lining up HIGH REWARD to RISK entry points. If the trade fails, you walk away with a small loss. But if it works, the return is nice and it's generally over a fairly short period of time.
Technical analysis, in my view, has tons of positives. The primary negative is that it's not always right. The signs provided don't always work out. But that's why we have STOPS - to minimize our risk.
I'll talk more about my trading strategies during today's "Trading Places LIVE" webinar at noon EST. Please join me if you can. REGISTER HERE, it's FREE!
Happy trading!
Tom
