Market Recap for Friday, January 15, 2016
After last Friday's rout to sustain the recent hemorrhaging of the U.S. stock market, one positive developed. The August low close of 1867.61 held. Friday's intraday low was 1857.83 so the bears had an opportunity to chase after the October 2014 lows, which in my opinion are the most significant on the chart. But instead, buyers emerged and the bulls held their ground on option expiration day and before a long holiday weekend. Here's the "kick save" on the S&P 500 from Friday:
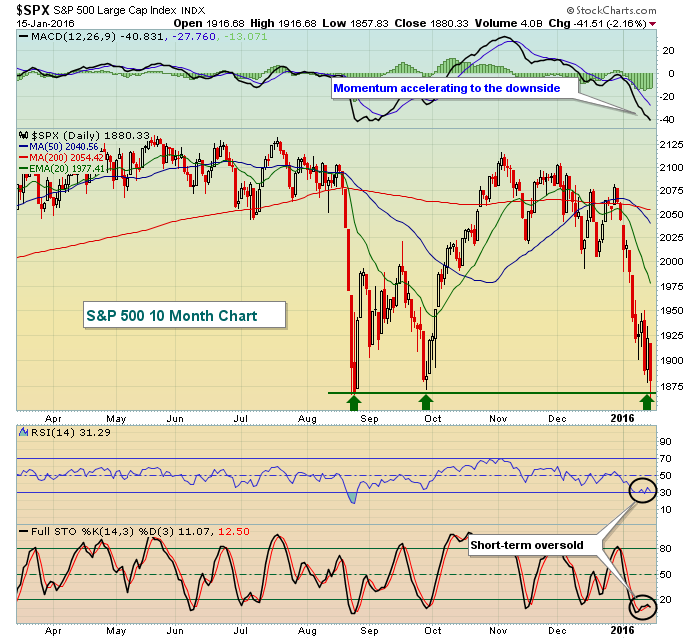
Technically, the S&P 500 has held support with very oversold oscillator readings. The RSI has been straddling the oversold 30 level for the past ten days. In the past ten months, the only time we've seen the S&P 500 this oversold near-term was in August. And the fact that we've hit key price support adds to the likelihood of a short-term bounce. At this point, I expect little more than that as the daily MACD is pointing straight down as selling momentum accelerates.
The best sectors on Friday included utilities (XLU), consumer staples (XLP) and healthcare (XLV). Not coincidentally, these three sectors have also been the best performing over the last week, last month and last three month periods. Utilities and consumer staples are leading over the past six months as well. This relative performance screams of RISK OFF trading/investing and is making it very difficult for gains to stick.
Pre-Market Action
U.S. markets were closed on Monday while Asian markets were mixed. China's Shanghai Composite ($SSEC) managed to hold onto its August lows with rallies the past two sessions. That's no doubt providing some relief here in the U.S. and as a result, futures are up more than 1% at last check. European markets were down slightly on Monday, but rallying 2%+ this morning.
Earnings season is kicking in and most reports out this morning are quite good. Most of the influential companies have reported bottom line numbers that have exceeded consensus estimates. The one exception thus far is Delta Airlines (DAL), which fell a penny short. That's a bit surprising given that crude oil prices ($WTIC) dropped nearly 20% during the fourth quarter. In the fourth quarter of 2014, crude oil prices had tumbled approximately 40% and airline stocks soared. Despite falling crude once again, this sequel is not playing out the same. There appears to be much more concern about the economy as the Fed has shifted its stance to one of raising interest rates.
If our economy truly is accelerating and the Fed's interest rate plans are correct, someone needs to send a memo to the bond market. The 10 year treasury yield ($TNX), while higher this morning to 2.06%, has been steadily declining since its November high near 2.35%. Shifting dollars into treasuries is a sign of a slowing economic picture, not an accelerating one. Hhhhmmmmm.
Current Outlook
In the short-term, I'd expect to see some sort of a rally off of price support. The 1867 price support level on the S&P 500 was highlighted above in the Market Recap section. Given the oversold conditions and the test of price support, the short-term direction should be higher. However, the Volatility Index ($VIX) soared above 30 on Friday, making the current trading environment treacherous at best. We're seeing the effects of such conditions with the routine 1%-2% gaps higher to begin many trading days. Risk is clearly elevated with short-term traders willing to hold positions overnight literally playing the stock market roulette wheel - red or black. Unfortunately for the bulls, red has been hitting a lot lately, especially at the opening bell.
Because of the expected volatility ($VIX) being so high, I'd consider the NASDAQ to currently be in a 400-450 point trading range. When momentum is strong to the downside like it is now, I view declining 20 period EMAs to be a huge obstacle during periods of reversal. The NASDAQ's current trading range is illustrated below:
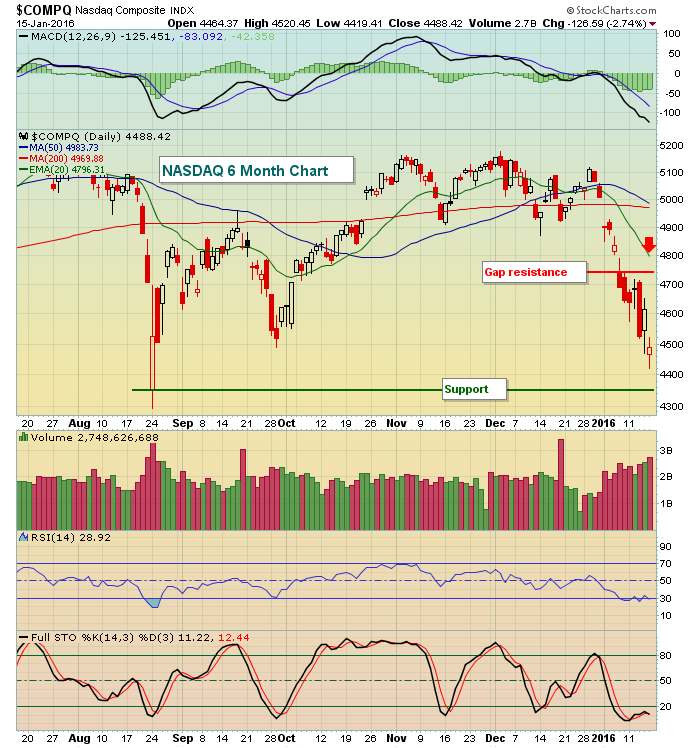
The red arrow highlights the declining 20 day EMA and you can see the strong selling momentum by reviewing the very weak MACD at the top of the chart.
The prices are roughly the same, so what's different now vs.the August lows? One word: Rotation. As I mentioned earlier in this article, the three defensive sectors are now leading on a relative basis over both short- and intermediate-term periods. Money is turning much more defensive. Relative ratios have turned incredibly bearish in a fairly short period of time and much of this occurred PRIOR to the January swoon in our major averages. That's the way it usually works, which is why it's so important to study the action underlying market movements on the surface. Look at where the transportation stocks ($TRAN) reside now relative to the utility stocks ($UTIL):
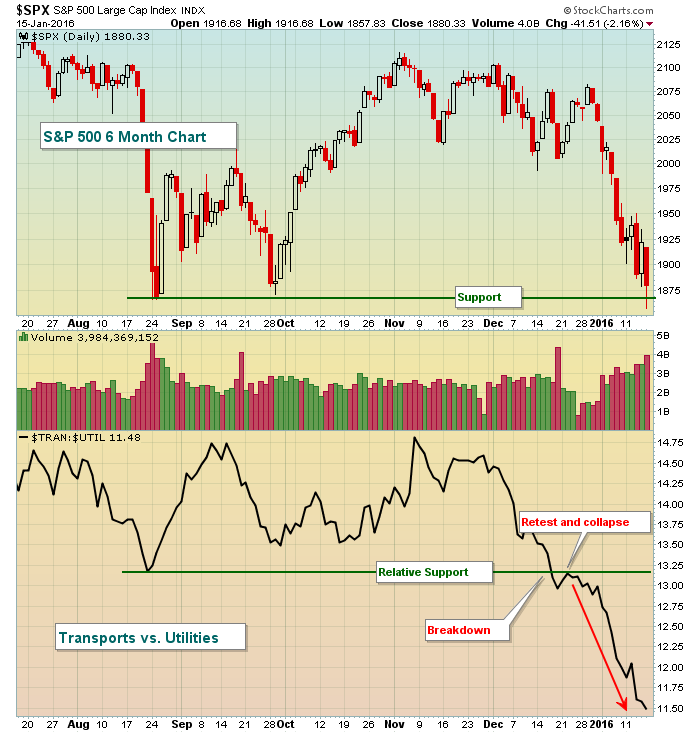
I think it's quite clear in this chart what the difference is. This isn't a mild breakdown in the relative strength of transports. This is a mass exodus out of transportation stocks and this group is positively correlated to expected economic conditions in the months ahead. So while the Fed tells us that economic conditions are improving, the market is saying something completely different. The stock market is widely viewed as a leading economic indicator. The one remaining silver lining is that price support on the intermediate-term chart has been holding on our key major indices.
Sector/Industry Watch
While many would observe that the S&P 500 has been flat to down the past couple years, there are pockets of strength - particularly in areas of defense. For instance, REITs are a defensive part of the financial sector. The residential REITs ($DJUSRN) have been particularly strong and have held up quite well during the recent market selloff. Check out the chart:
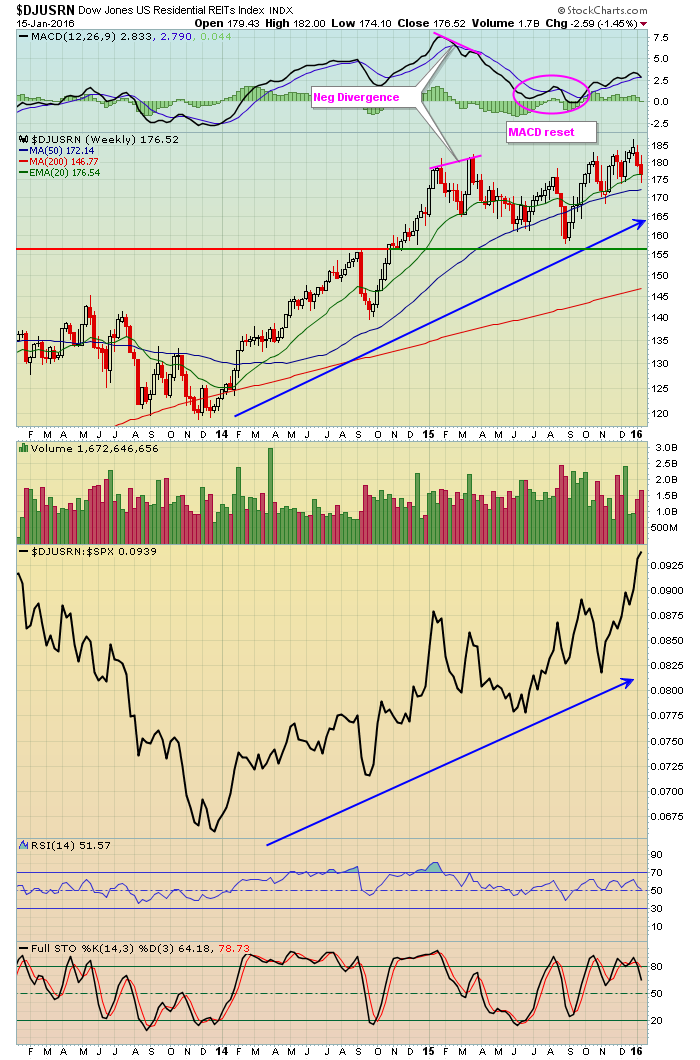
Most REITs have performed exceptionally well the past two years while the S&P 500 has meandered mostly in sideways fashion. On the DJUSRN chart above, there was one period of slowing momentum in the first quarter of 2015. That resulted in several months of sideways to lower action until the weekly MACD reset at centerline support. Since that time, the DJUSRN has been outperforming the S&P 500 by a very wide margin. It's certainly not hurting that money is gravitating towards defense. Barring a sudden change in economic fortunes, I'd expect the DJUSRN to continue to outperform the S&P 500.
Historical Tendencies
Since 1950 on the S&P 500, the 19th day of the calendar month produces negative annualized returns of -34.10%. It's the worst calendar day of the month. Even if we remove the performance of October 19th, 1987 (Black Monday), the 19th remains the worst calendar day of the month. My theory is simple. The stock market tends (1) to move higher anticipating strong earnings seasons and (2) money flows during the middle of the month tend to send prices higher. Both of these occur PRIOR to the 19th and just before stock option expiration day (3rd Friday of each month). Therefore, profit taking is likely a part of the reason, but also market makers on the other side of option trades likely have a vested interest in the stock market moving lower into option expiration day and into the week after options expire. That's most likely the reason why the stock market struggles from the 18th through the 27th of the calendar month.
Key Earnings Reports
(actual vs. estimate):
BAC: .28 vs .27
CMA: .71 vs .69
DAL: 1.18 vs .1.19
MS: .43 vs .35
SCHW: .28 vs .25
UNH: 1.40 vs 1.37
(reports after close, estimate provided):
IBM: 4.76
NFLX: .02
Key Economic Reports
January housing market index to be released at 10:00am EST: 62 (estimate)
Happy trading!
Tom
