Market Recap for Tuesday, July 25, 2017
Energy shares (XLE, +1.26%) received another boost when crude oil prices ($WTIC) surged on Tuesday to close at $47.89 per barrel (+3.34%), its highest close in nearly two months. While the crude oil spike extends a very nice rally off its triple bottom low in June, the XLE has yet to break the steep downtrend that it's been mired in during 2017. Here's a current chart of both the WTIC and XLE:
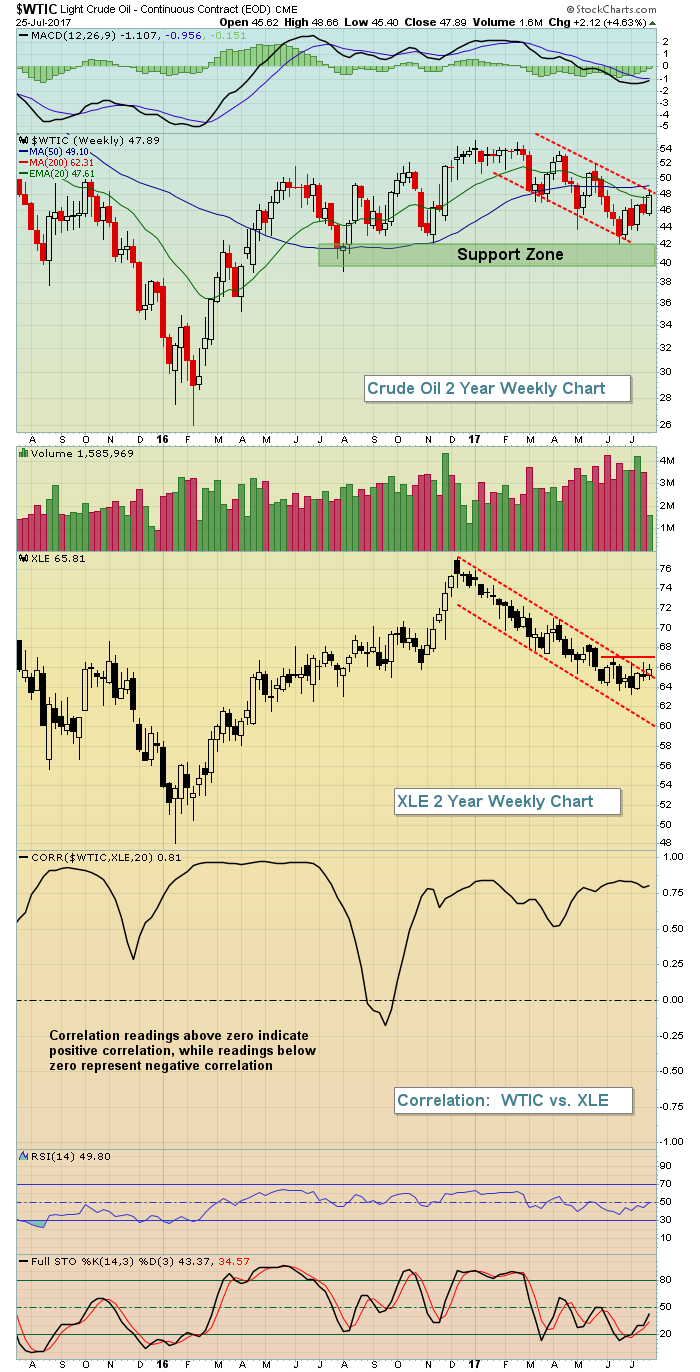 The parallel red dotted lines on both charts show the downtrends that WTIC and XLE have endured in 2017. Both are on the verge of breaking those downtrend channels and doing so would be quite bullish - at least in the near-term.
Financials (XLF, +1.24%) were also very strong on Tuesday, with banks ($DJUSBK) leading the charge. Only the REITs struggled as the XLF broke out of a very bullish cup with handle pattern that measures up to approximately 27.45. Check this out:
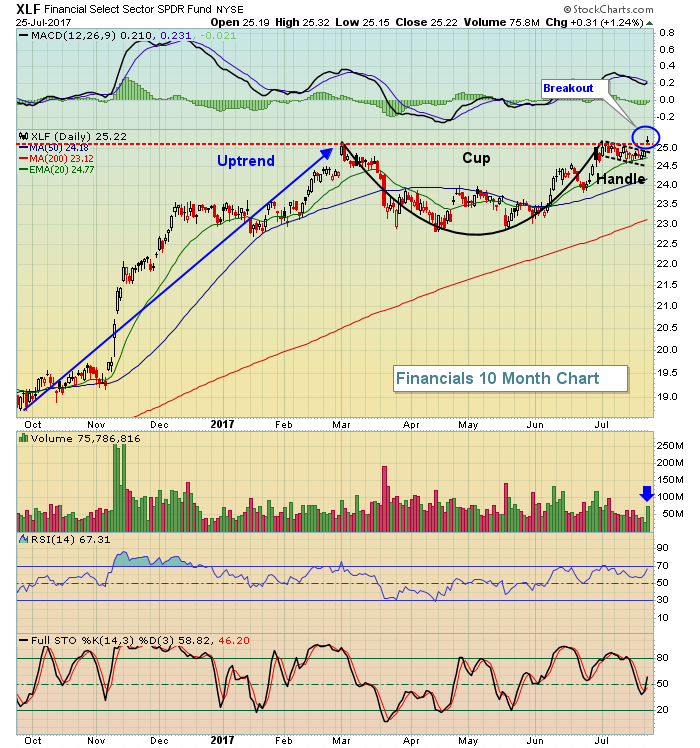 The measurement is determined by subtracting the bottom of the cup (22.75) from the top (25.10). That's a pattern measurement of 2.35 points, which is then added to the breakout level of 25.10. That suggests another push higher in the XLF to 27.45.
Materials (XLB, +1.07%) also enjoyed a very strong day as copper ($COPPER) surged to 2.85, its highest close in more than two years, clearing earlier highs in February 2017. Copper is featured below in the Sector/Industry Watch section.
Pre-Market Action
Treasuries sold off hard on Tuesday with the corresponding 10 year treasury yield ($TNX) rising eight basis points from 2.25% to 2.33%. The yield has ticked a bit lower today and that'll likely put some early pressure on banks and other financials. However, it's the reaction after 2pm EST (FOMC announcement) that I'll be most interested in. Will Fed Chair Yellen provide more details on the unwinding of its balance sheet? Will she give more guidance as to expected rate hikes?
Copper ($COPPER) has taken a break and is flat this morning after yesterday's huge advance, but crude oil ($WTIC) is continuing its recent torrid pace higher. The WTIC is up another 1% or so this morning and has easily cleared $48 per barrel and could close there for the first time since early June. Further strength in crude could be the catalyst to send energy (XLE) above the 67 resistance level. In addition to price resistance at 67 that was highlighted in an earlier chart, XLE has not closed above its declining 20 week EMA since the first week of February and that 20 week EMA currently resides at 66.69. So a push through 67 would also clear a major technical hurdle on the XLE's weekly chart as well.
Asian markets were mostly higher overnight and European markets are mostly rising this morning as the global equity rally rises almost unabated. U.S. stocks are following the lead of other markets as Dow Jones futures are up 69 points with a bit more than 30 minutes left to the opening bell. The Dow Jones all-time high of 21,681.53 could be threatened as soon as that opening bell rings.
Current Outlook
After reviewing MACD divergences on the longer-term weekly charts, healthcare (XLV) appears to be the safest sector as we meander our way through the summer months. I've discussed previously the weekly negative divergences on our major indices and all four of our aggressive sectors - technology (XLK), industrials (XLI), consumer discretionary (XLY) and financials (XLF) - have printed that same weekly negative divergence on their MACDs. So which sector shows accelerating long-term momentum? Healthcare, take a look:
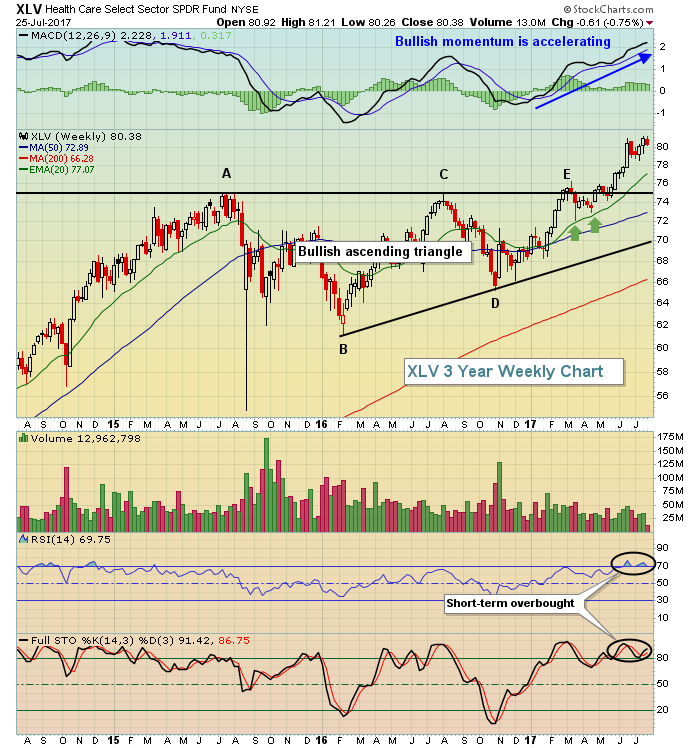 Healthcare is not immune to short-term selling as the group is overbought with its weekly RSI and stochastic at 70 and 91, respectively. But I fully expect that the XLV will find buyers if it were to drop back to test that rising 20 week EMA, currently at 77.07. Also, I've written a number of articles over the past couple months discussing why I believe biotechnology stocks ($DJUSBT) are heading significantly higher. This is the group that I expect to lead healthcare for the balance of 2017.
Sector/Industry Watch
It's been awhile since copper ($COPPER) has looked bullish, but yesterday's breakout was a thing of beauty and lit a fire under Freeport McMoran (FCX). This picture paints a thousand bullish words:
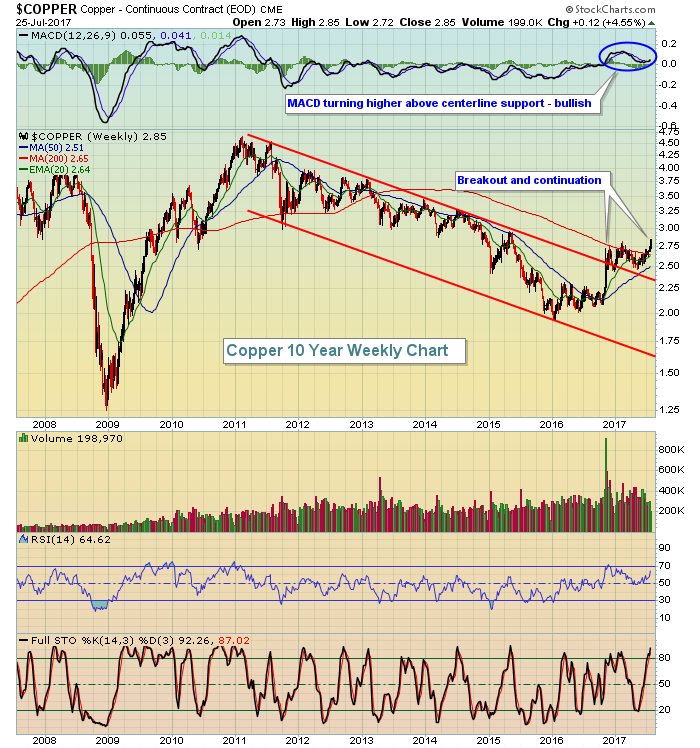 That 5+ year downtrend channel was broken back in February and yesterday's breakout further confirms that the downtrend has ended. Rising copper prices are nirvana for Freeport McMoran (FCX) and the stock responded about the way I'd have expected:
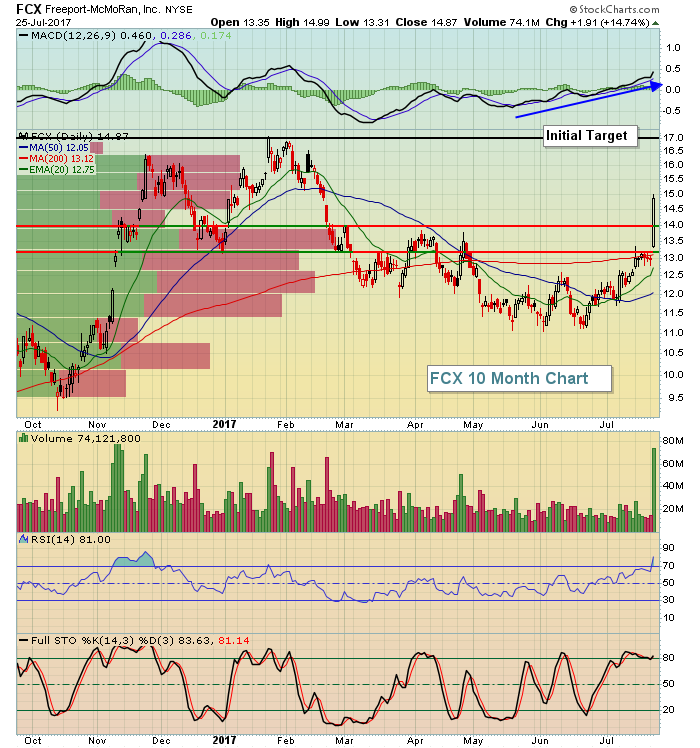 There's a lot to like here. First, the volume soared on Tuesday to accompany and confirm the breakout. Second, check out the volume by price bars that appear from the left side of the chart to the right. The heaviest volume has occurred between two key pivot points at 13.25 and 14.00. Clearing that area suggests a potentially quick trip to test the January high near 17. On the flip side, a pullback to test the upper support line near 14.00 would be a solid reward to risk entry. Consider a second entry at 13.25. For those that are risk averse, beware. FCX is a fast mover that will move consistently with the direction of copper prices. FCX topped in 2011 as copper prices topped and many times will move even faster than this volatile commodity.
Historical Tendencies
We're less than a week away from August and this summer month has not been kind to U.S. equities over the past two decades. The S&P 500, NASDAQ and Russell 2000 have posted average August returns of -1.1%, -0.9% and -1.2%, respectively, over this past 20 year period. That's the worst calendar month period for each of these major indices. The second worst calendar month? September. Seasonal patterns are suggesting that we buckle up while technical price action remains bullish as we keep breaking out to fresh all-time highs on our major indices. Which wins out? We'll have that answer in two months.
Key Earnings Reports
(actual vs. estimate):
ANTM: 3.37 vs 3.25
BA: 2.55 vs 2.32
BAX: .63 vs .57
F: .56 vs .44
GD: 2.45 vs 2.43
GLW: .42 vs .40
HSY: 1.09 vs .91
IR: 1.49 vs 1.46
KO: .59 vs .57
NEE: 1.86 vs 1.74
NOC: 3.15 vs 2.84
NSC: 1.71 vs 1.64
ROK: 1.76 vs 1.64
STT: 1.67 vs 1.57
TEL: 1.24 vs 1.17
TMO: 2.30 vs 2.26
WM: .81 vs .82
(reports after close, estimate provided):
DFS: 1.45
EW: .88
FB: 1.13
GILD: 2.11
LRCX: 3.02
LVS: .61
PSA: 2.56
PYPL: .32
SU: .20
VRTX: .06
XLNX: .60
Key Economic Reports
June new homes sales to be released at 10:00am EST: 611,000 (estimate)
FOMC meeting concludes with 2pm EST policy statement
Happy trading!
Tom
