
With today's rally pop, I decided to check my Momentum Sleepers Scan for possible diamonds in the rough. I found four from that scan and one from my Chart Breakouts Scan. The VIX and advance/declines suggest more upside in the very short term, but the rest of the DP indicators aren't quite so rosy. Check out today's "DP Alert Mid-Week" article for more details. Remember that "Momentum Sleepers" are stocks that have been beaten down but are building momentum under the surface. Consequently, the weekly charts don't always look that great. However, today I found a few with nice weekly chart configurations.
I love to get your feedback on DP commentary, so shoot me an email at erinh@stockcharts.com. I read every one of them and try to answer them all! Your insight helps me to tailor my commentary to what my readers and viewers want to hear about.
Welcome to DecisionPoint Daily Diamonds, wherein I highlight five "diamonds in the rough." These are selected from the results of my DecisionPoint scans, which search for stocks that could benefit from the trend and condition of the market. Remember, these are not recommendations to buy or sell, but are the most interesting of the stocks that surfaced in my scans. My objective is to save you the work of the initial, tedious culling process, but you need to apply your own analysis to see if these stocks pique your interest as well. There are no guaranteed winners here!
Current Market Outlook:
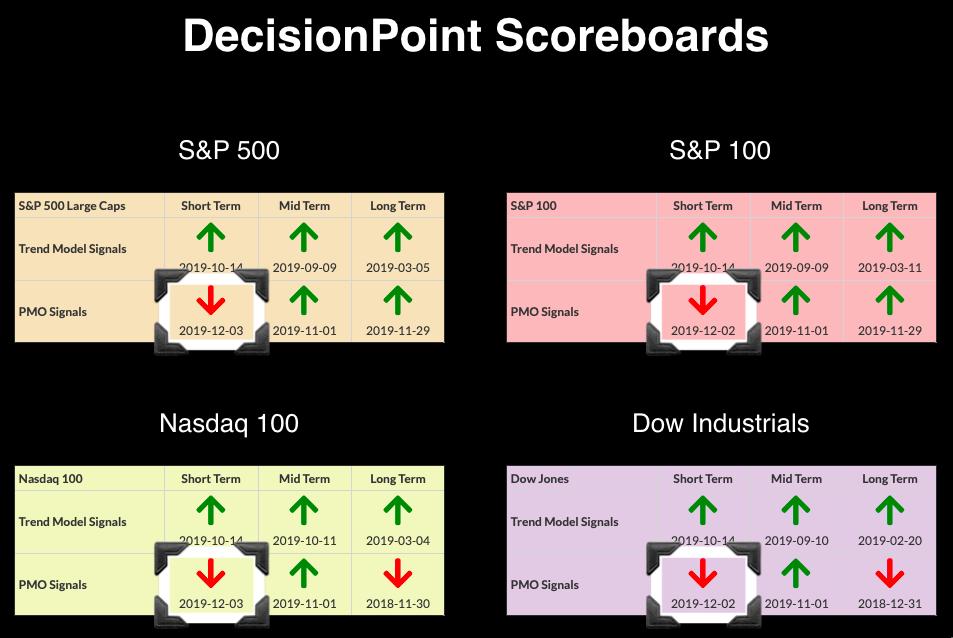
Market Trend: Currently, we have Trend Model BUY signals in all three timeframes on the DP Scoreboard Indexes.
Market Condition: The market is overbought and this week we had four new PMO SELL signals. Caution is warranted.
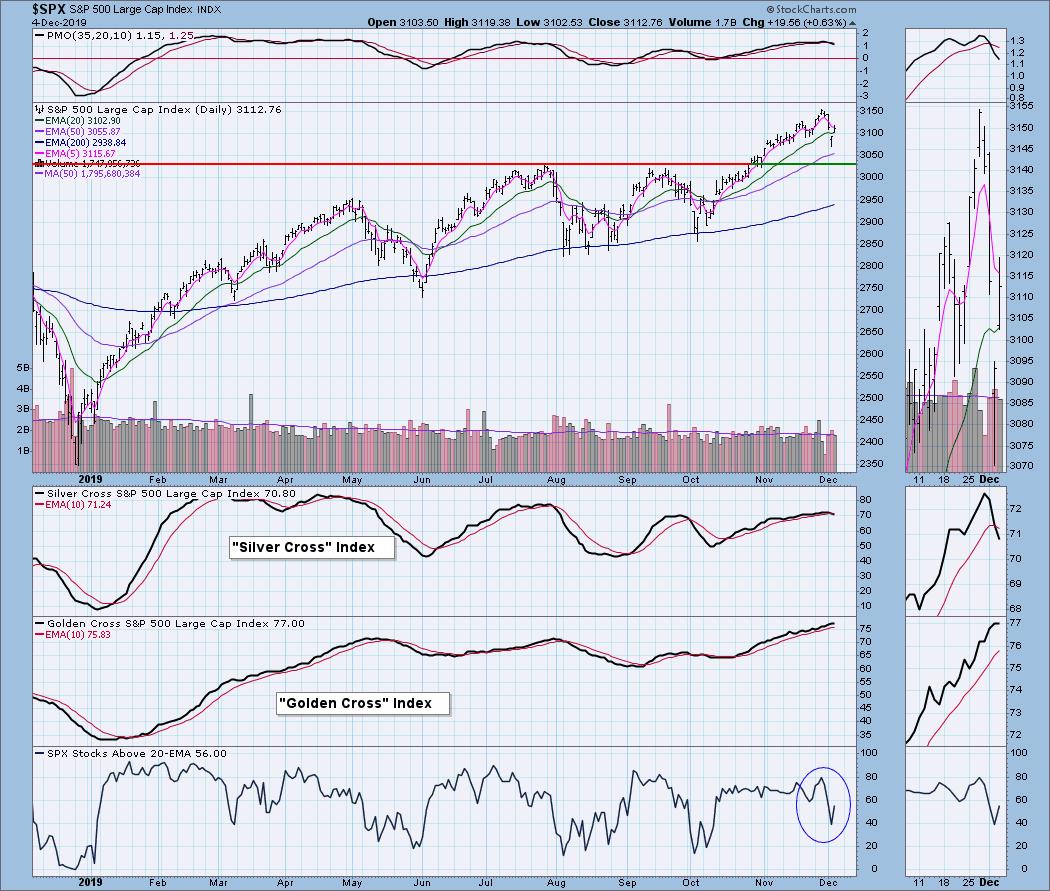
Market Environment: It is important to consider the odds for success. The Silver Cross Index measures the percentage of stocks on IT Trend Model BUY signals (20-EMA > 50-EMA), while the Golden Cross Index measures the percentage of stocks on LT Trend Model BUY signals (50-EMA > 200-EMA). Here are the current percentages on the Silver and Golden Cross Indexes:
Diamond Index:
- Diamond Scan Results: 1
- Diamond Dog Scan Results: 20
- Diamond Bull/Bear Ratio: 0.2
Alarm.com Holdings Inc (ALRM) - Earnings: 11/5/2019
This one is very beaten down, but is forming a double-bottom. The price lows are in a positive divergence with the OBV. The PMO is turning up, but it also did that on the first rally and still failed. This may be the place for a turnaround.
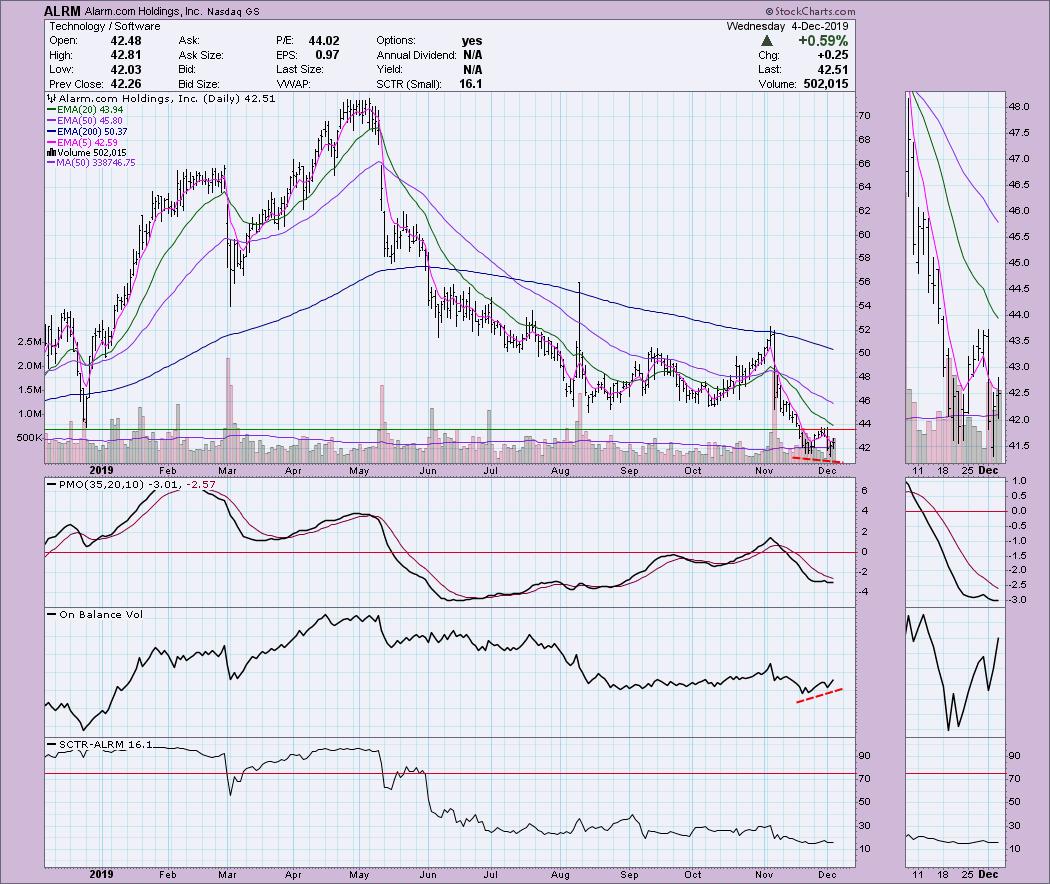
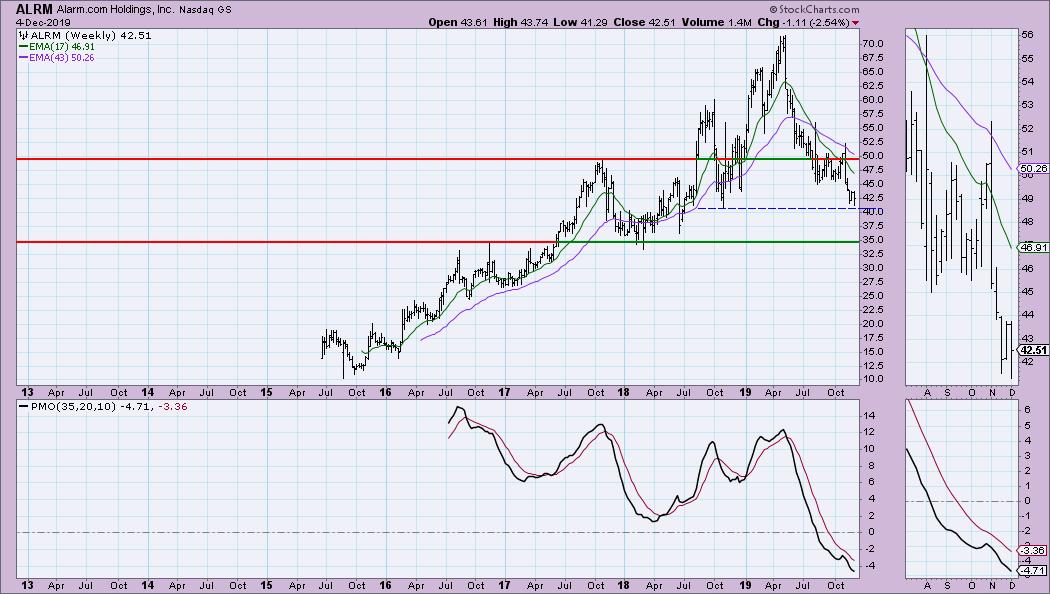
Price is seated on support at the 2018 fourth quarter price low, but the strongest support lies much lower at $35. I would put this on a short leash.
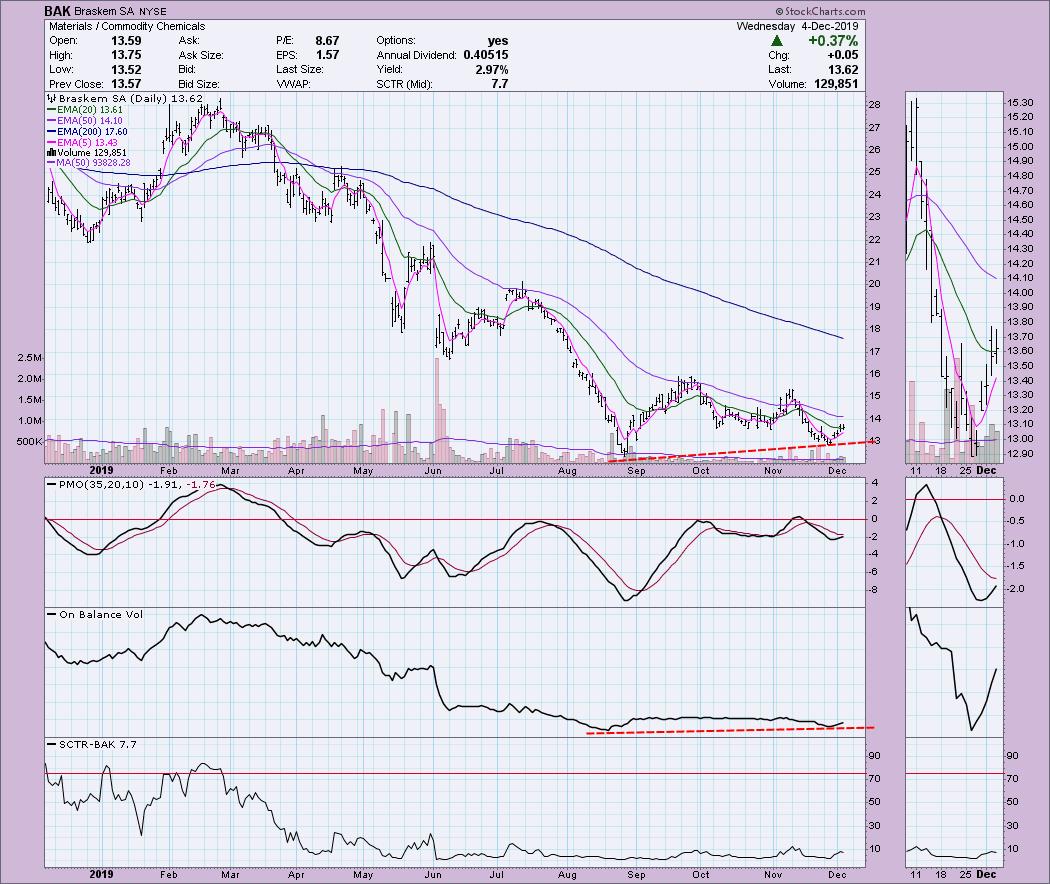
Braskem SA (BAK) - Earnings: N/A
This one is interesting in that it put in a higher price low and was subsequently confirmed by the OBV with a slightly higher reading on the second bottom. The PMO looks strong and is certainly less hesitant than in October. At the same time, price is butted up against short-term resistance at those October lows. Price just closed above the 20-EMA. My target would be around $16 or $17.
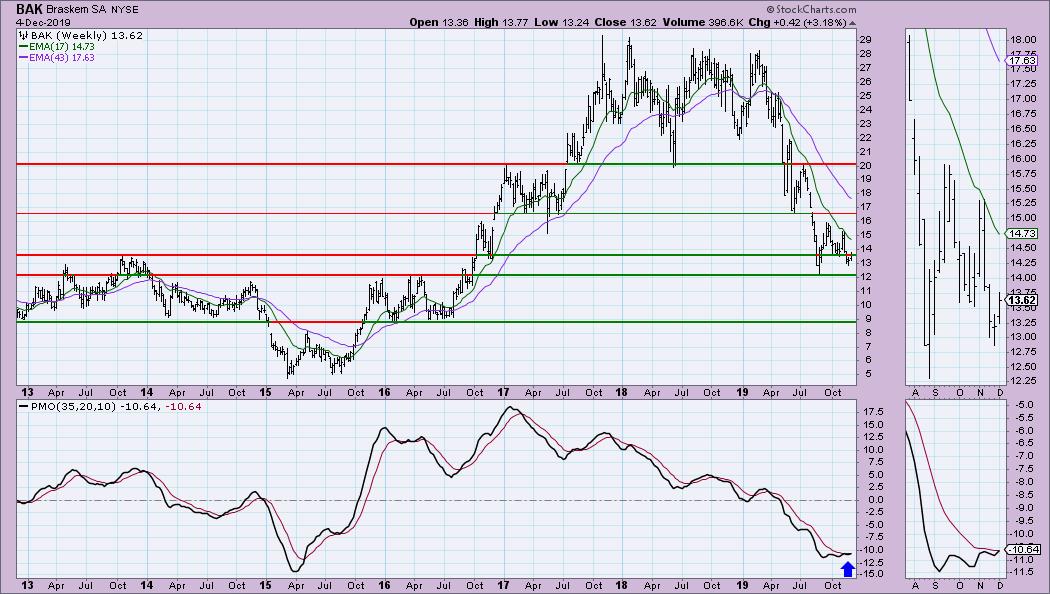
Lots of support and resistance lines here. $16.50 looks like a good target and, should it break out there, we could see a move to $20. I like the PMO, which is about to give us a buy signal at the end of the week.
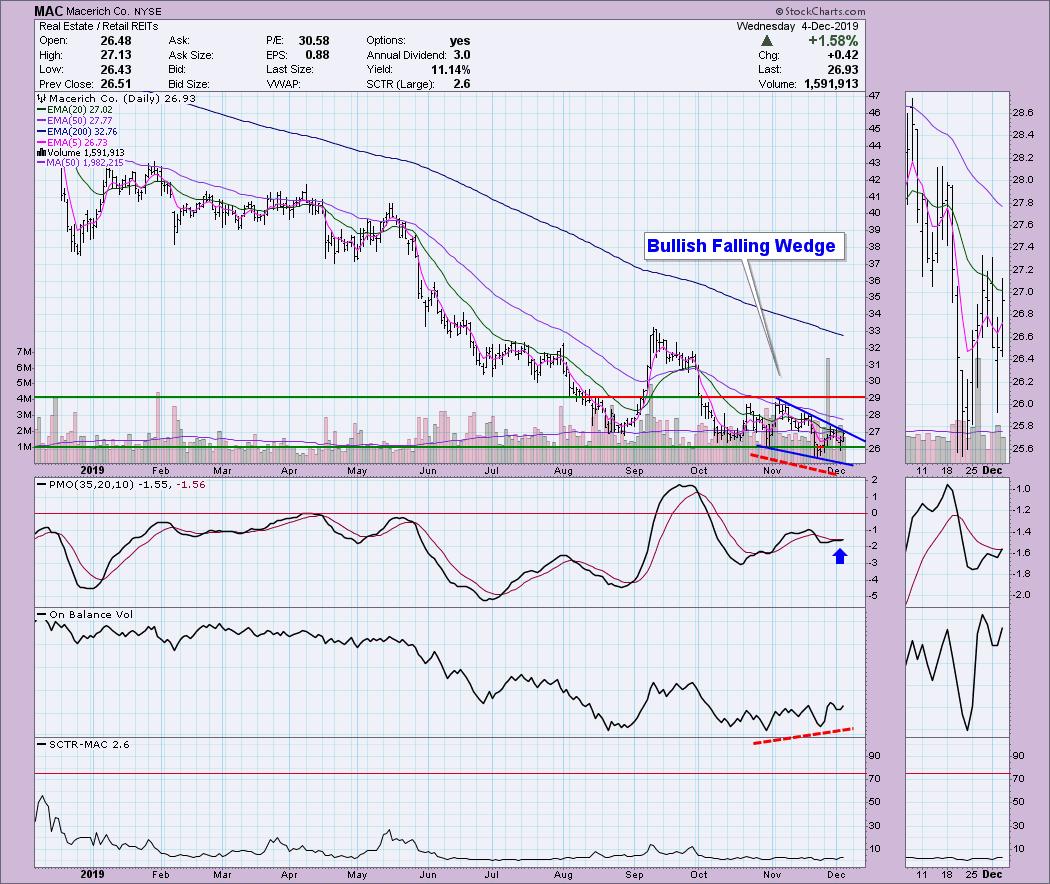
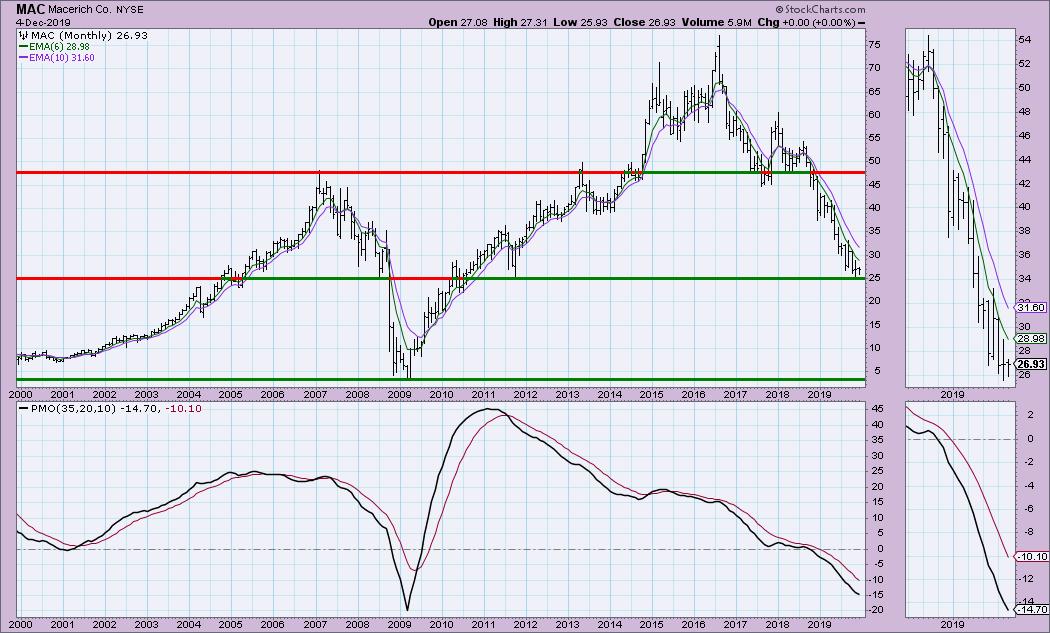
Macerich Co (MAC) - Earnings: 2/5 - 2/10/2020
I think the positives on this chart outweigh the negative EMA configuration. We have a bullish falling wedge, which suggests an upside breakout. Additionally we have a strong positive divergence with the OBV. The PMO is about to click into a BUY signal. The SCTR needs some help, but this is a beat-down stock.
The weekly chart doesn't demonstrate support levels, but it does show a nice PMO configuration, which is in a positive divergence with price lows.
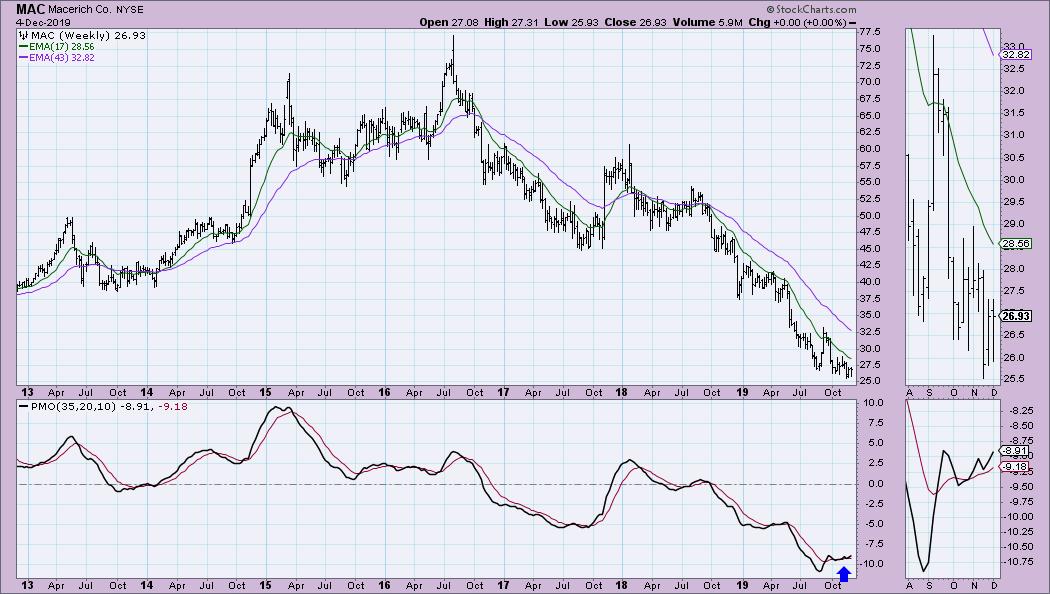
Price is seated on a support level that matches up with the 2011 low. The PMO is in decline, but it is now in oversold territory.
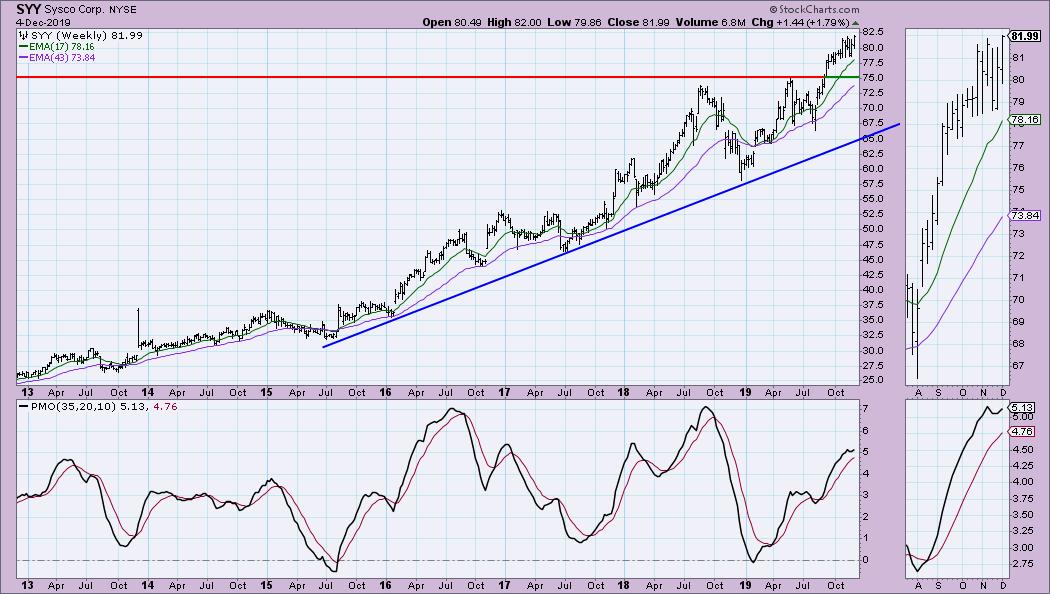
Sysco Corp (SYY) - Earnings: 2/3 - 2/7/2020
SYY came from my Chart Breakouts Scan. My overhead resistance line is fat, but you can see in the thumbnail that price broke out and closed near the day's high. The PMO is ready for a BUY signal and the OBV is confirming the breakout.
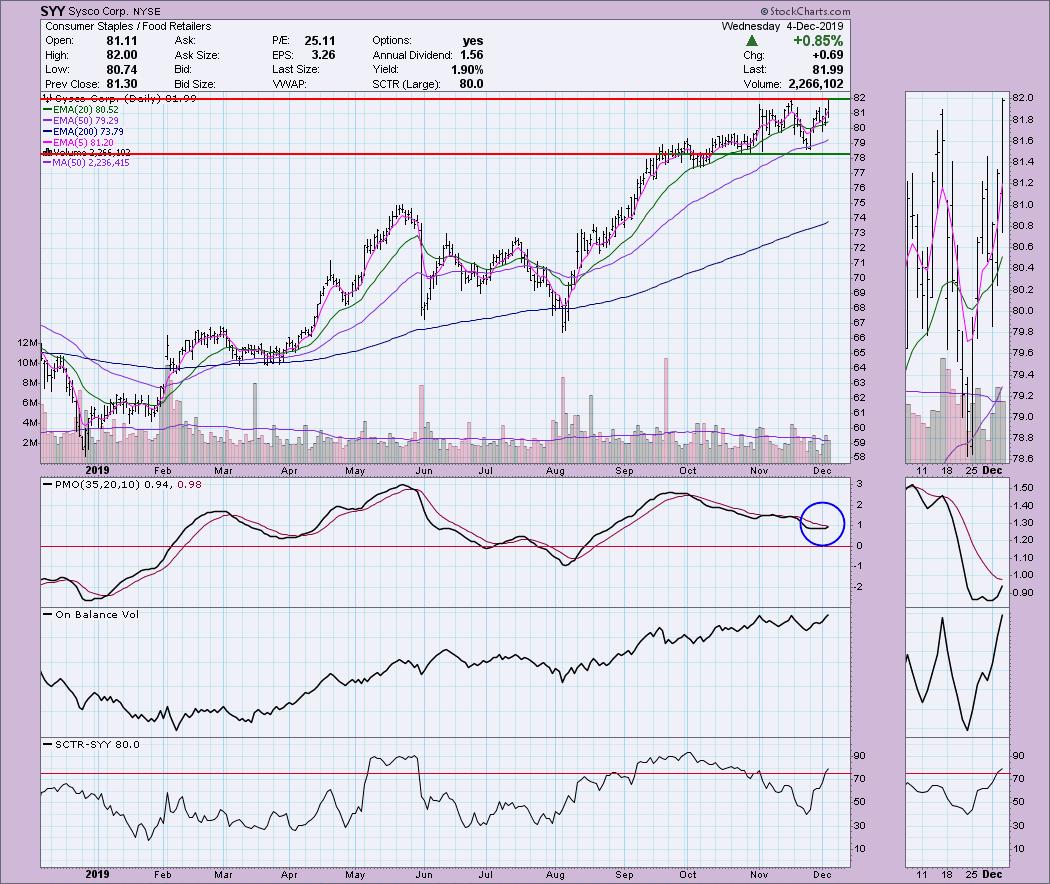
The weekly PMO bottomed above the signal line, which I always find especially bullish. The PMO is not overbought. Price is overbought on this one as today marked an all-time high. If the market continues to be "iffy," this one is in the Consumer Staples sector which is considered defensive. I checked the monthly chart; the monthly PMO just had a crossover and is continuing to rise.
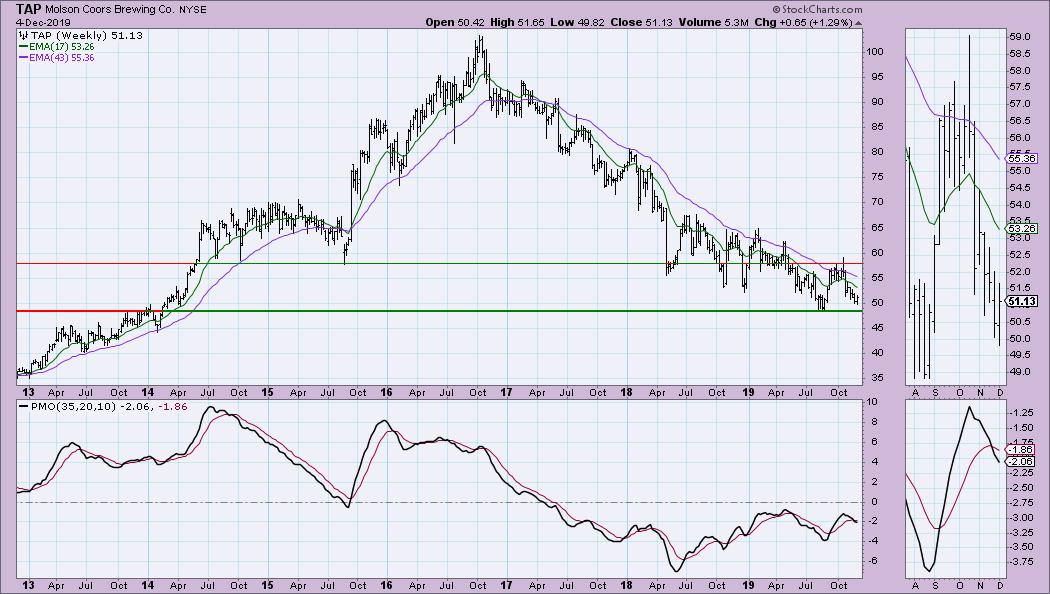
Molson Coors Brewing Co (TAP) - Earnings: 2/10 - 2/14/2020
The PMO just turned up on this one in oversold territory. We have another positive divergence between price and the OBV. The SCTR needs some work and today's big price rise may need a pullback.
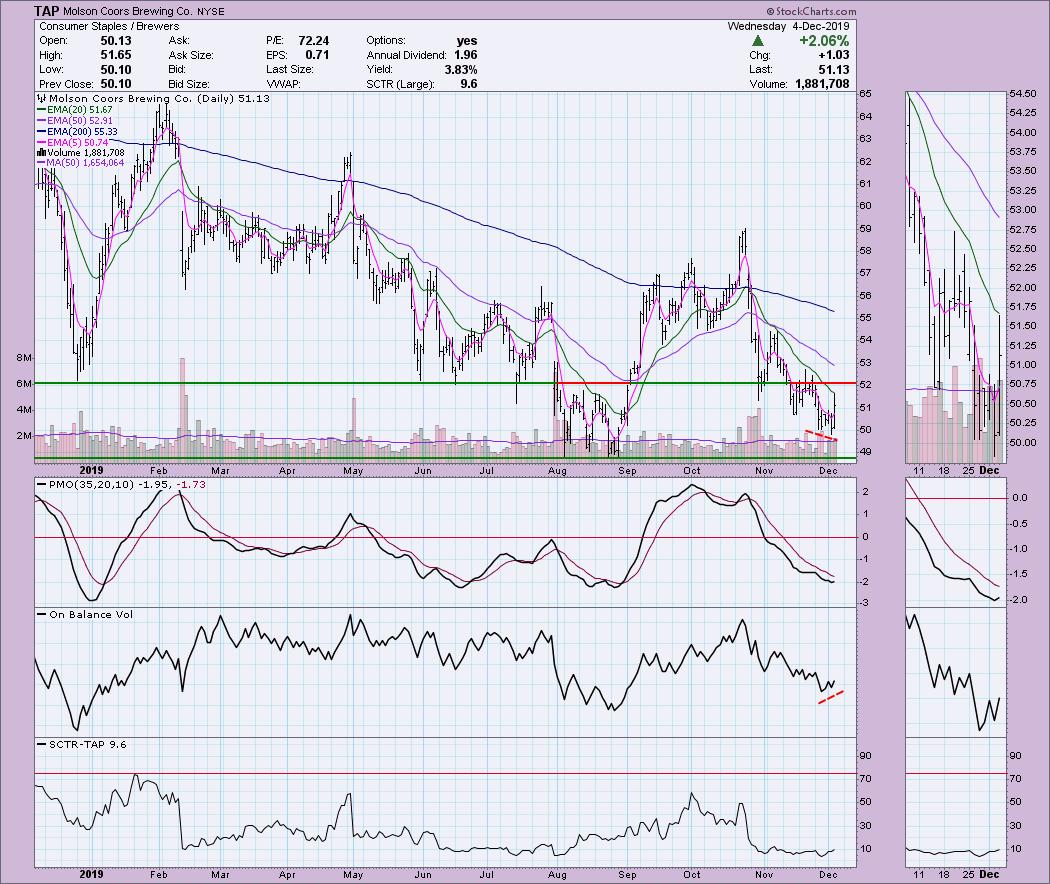
Price is just about at support. Obviously the PMO doesn't look great, as it has just given a SELL signal, but I think this area of support is very interesting and could be a springboard later.
Full Disclosure: I do not own any of the stocks presented and I am not quite ready for entry. I remain in 80% cash.
Sign Up for Market Vision 2020 Email List!
I will be presenting at the "Market Vision 2020" online conference on January 4th! It is sponsored by EarningsBeats.com and promises to be "THE" event to start the new year. We will have many of the commentators that you love presenting their "market view" for 2020, with John Murphy as the keynote speaker! For information on the event, sign up for the free emails, which will give you all the details as we get closer!

Erin Swenlin will be presenting at the The MoneyShow Las Vegas May 11-13, 2020! You'll have an opportunity to meet Erin and discuss the latest DecisionPoint news and Diamond Scans. The conference is free to attend or view online!
Watch the latest episode of DecisionPoint with Carl & Erin Swenlin LIVE on Mondays 5:00p EST or on the StockCharts TV YouTube channel here!
Technical Analysis is a windsock, not a crystal ball.
Happy Charting!
- Erin
erinh@stockcharts.com
NOTE: The stocks reported herein are from mechanical trading model scans that are based upon moving average relationships, momentum and volume. DecisionPoint analysis is then applied to get five selections from the scans. The selections given should prompt readers to do a chart review using their own analysis process. This letter is not a call for a specific action to buy, sell or short any of the stocks provided. There are NO sure things or guaranteed returns on the daily selection of "diamonds in the rough."
Helpful DecisionPoint Links:
DecisionPoint Shared ChartList and DecisionPoint Chart Gallery
Price Momentum Oscillator (PMO)
Swenlin Trading Oscillators (STO-B and STO-V)
**Don't miss DecisionPoint Commentary! Add your email below to be notified of new updates"**