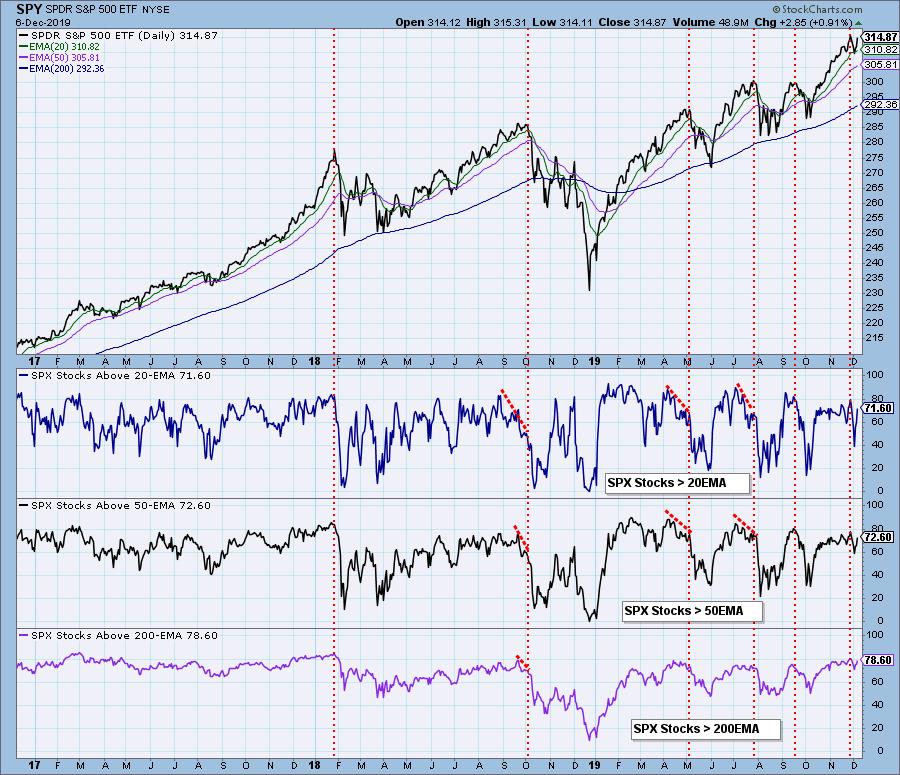
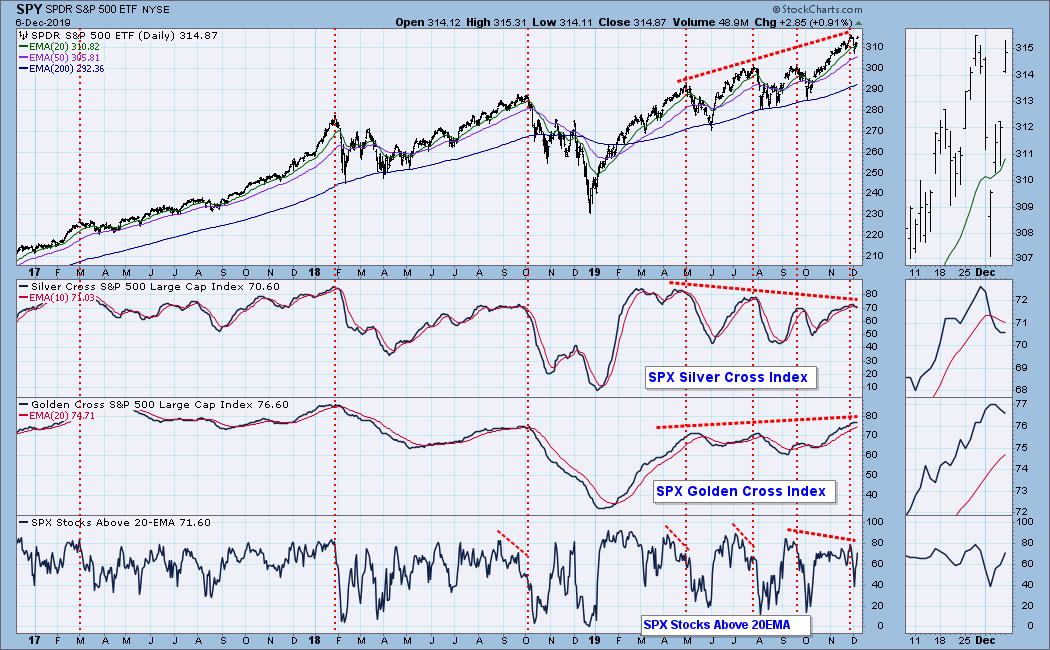
A good way to gauge participation in a particular market move is to check the percentage of stocks that are above their 20/50/200EMAs. The 20EMA indicator is short-term and most responsive, and we can see the deterioration that took place prior to some of the important price tops on the chart below. Curiously, there was no deterioration prior to the recent November 27 price top; although, the 20EMA indicator fell by more than half during the three-day pullback from that top. Note that the indicator highs at the recent price top were somewhat lower that at previous price tops.
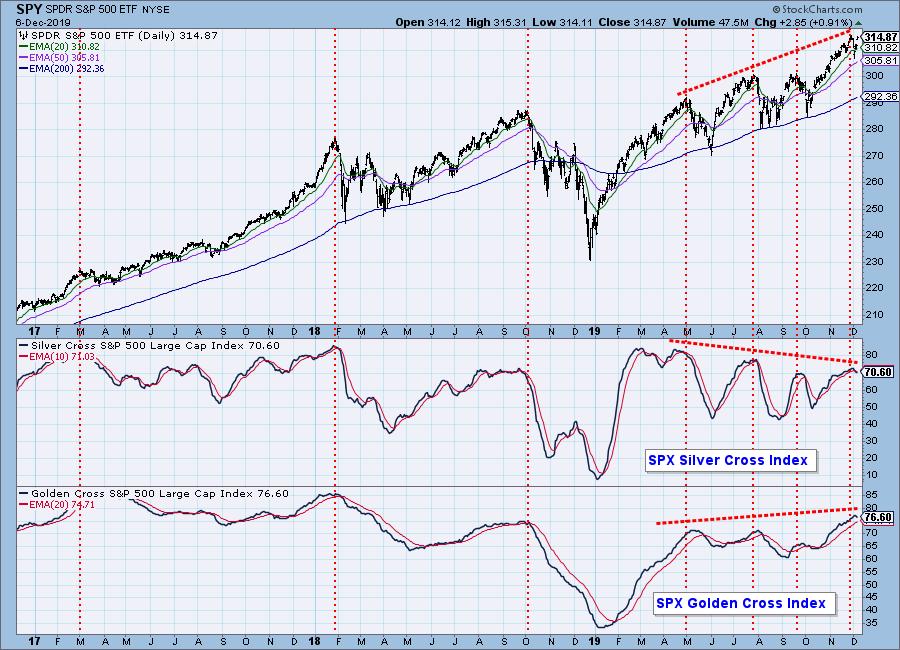
Other great participation gauges are the Golden Cross and Silver Cross Indexes, which show respectively the percentage of SPX stocks which have 50EMA/200EMA and 20EMA/50EMA upside crossovers. As I said, they are not robust, being far from their January 2018 levels, but they reflect adequate participation. Problematic are the progressively lower tops on the Silver Cross Index, a negative divergence that begs for a correction.
The DecisionPoint Weekly Wrap presents an end-of-week assessment of the trend and condition of the stock market (S&P 500), the U.S. Dollar, Gold, Crude Oil, and Bonds.
Watch the latest episode of DecisionPoint on StockCharts TV's YouTube channel here!
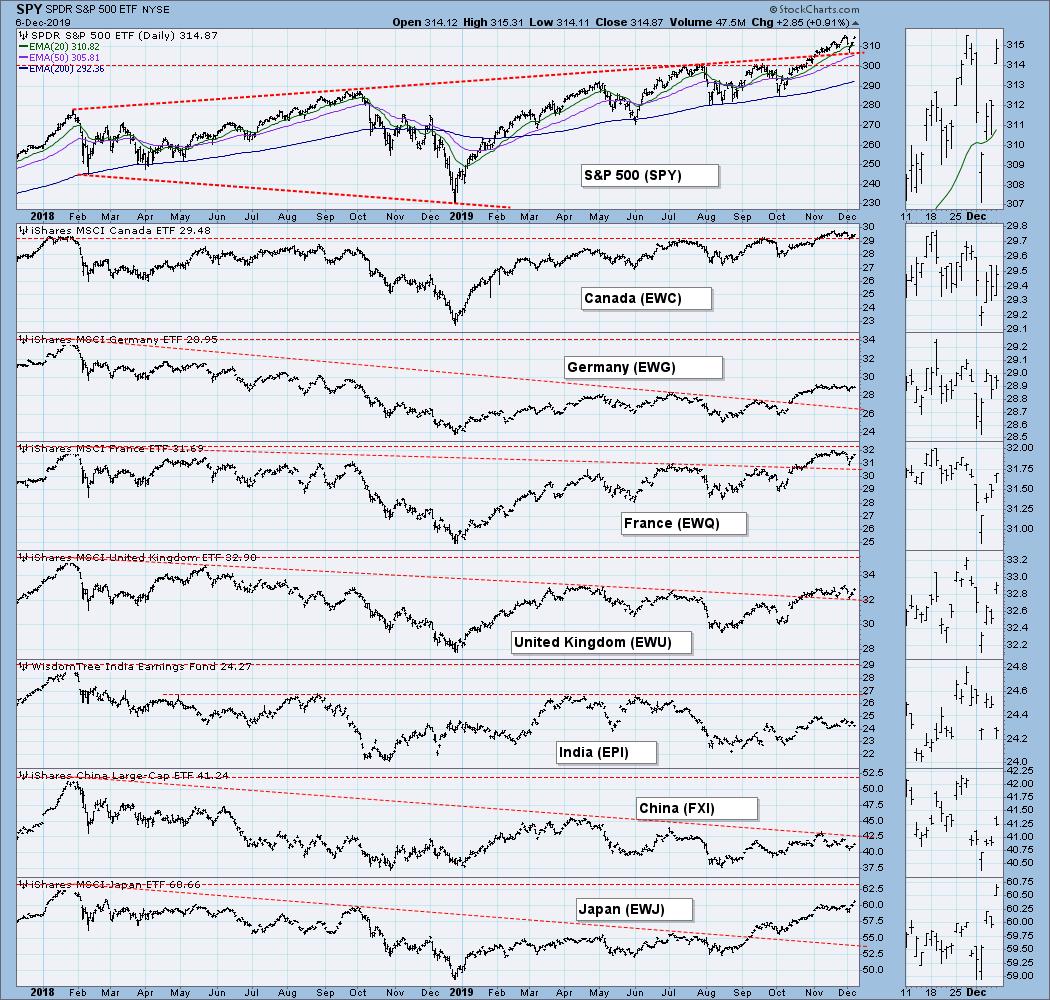
GLOBAL MARKETS
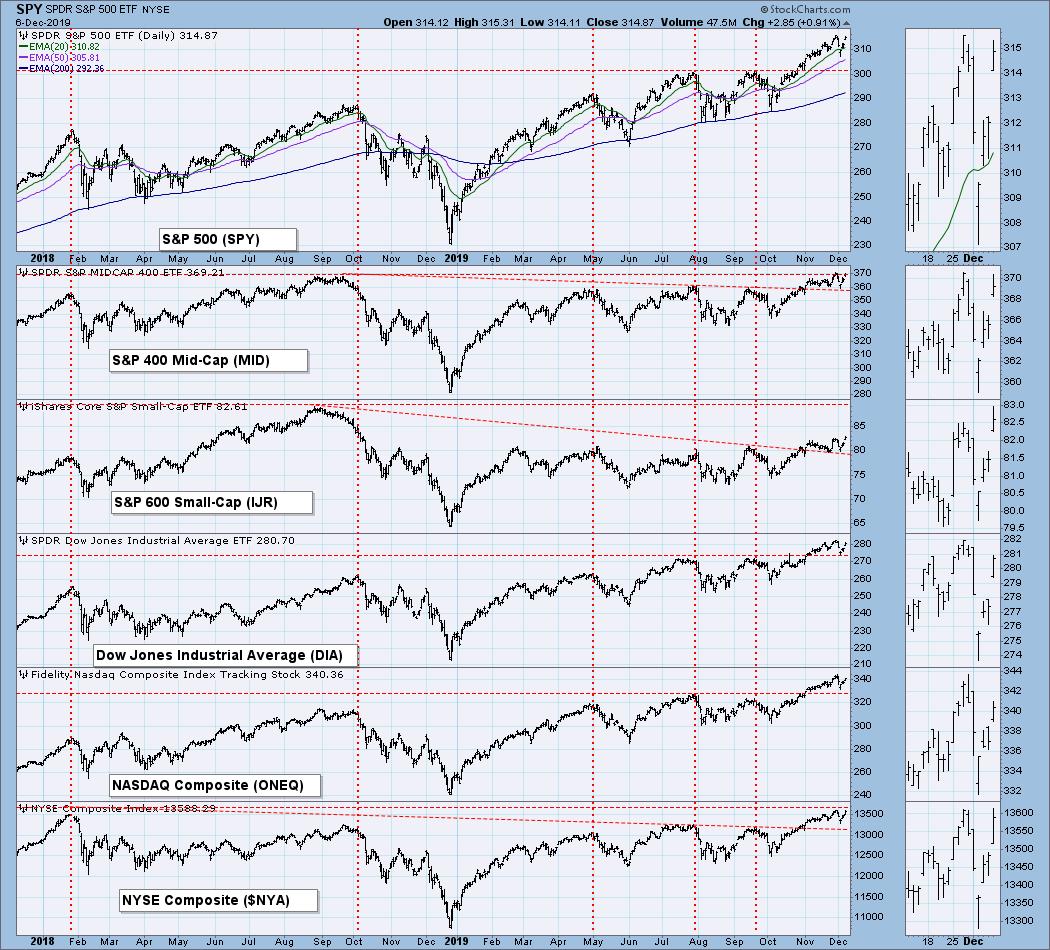
BROAD MARKET INDEXES
SECTORS
Each S&P 500 Index component stock is assigned to one, and only one, of 11 major sectors. This is a snapshot of the Intermediate-Term and Long-Term Trend Model signal status for those sectors.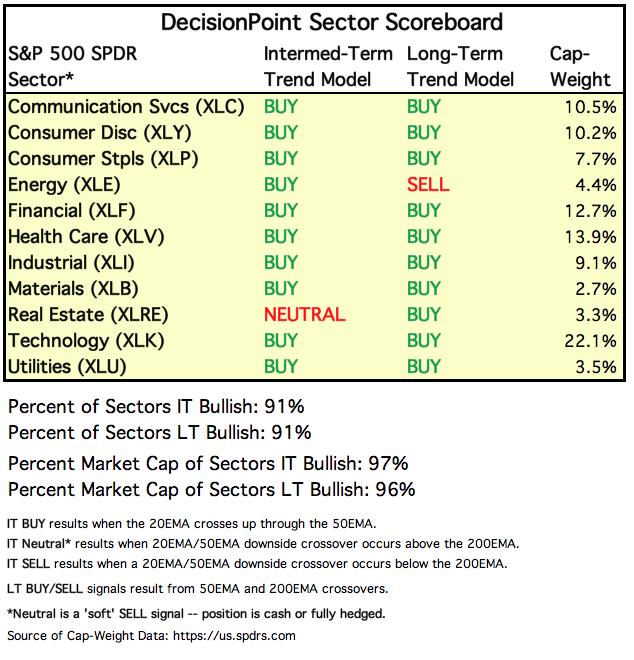
INTEREST RATES
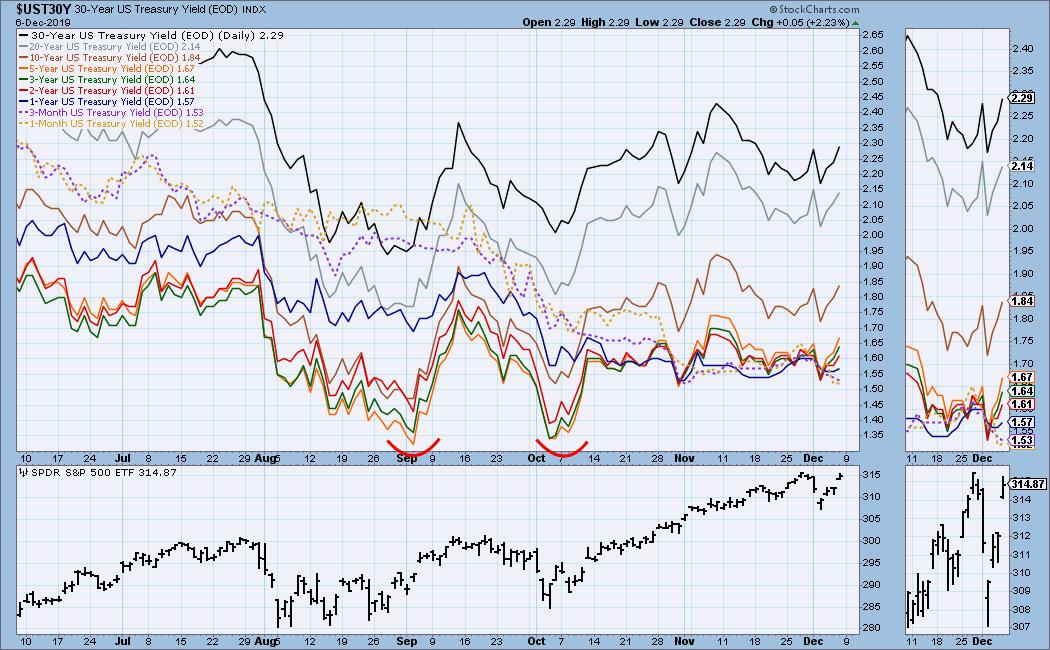
This chart is included so we can monitor rate inversions. In normal circumstances the longer money is borrowed the higher the interest rate that must be paid. When rates are inverted, the reverse is true. Shorter duration instruments are very close together, and occasionally invert, but the 2-year and 10-year is normal at this time.
STOCKS
IT Trend Model: BUY as of 9/6/2019
LT Trend Model: BUY as of 2/26/2019
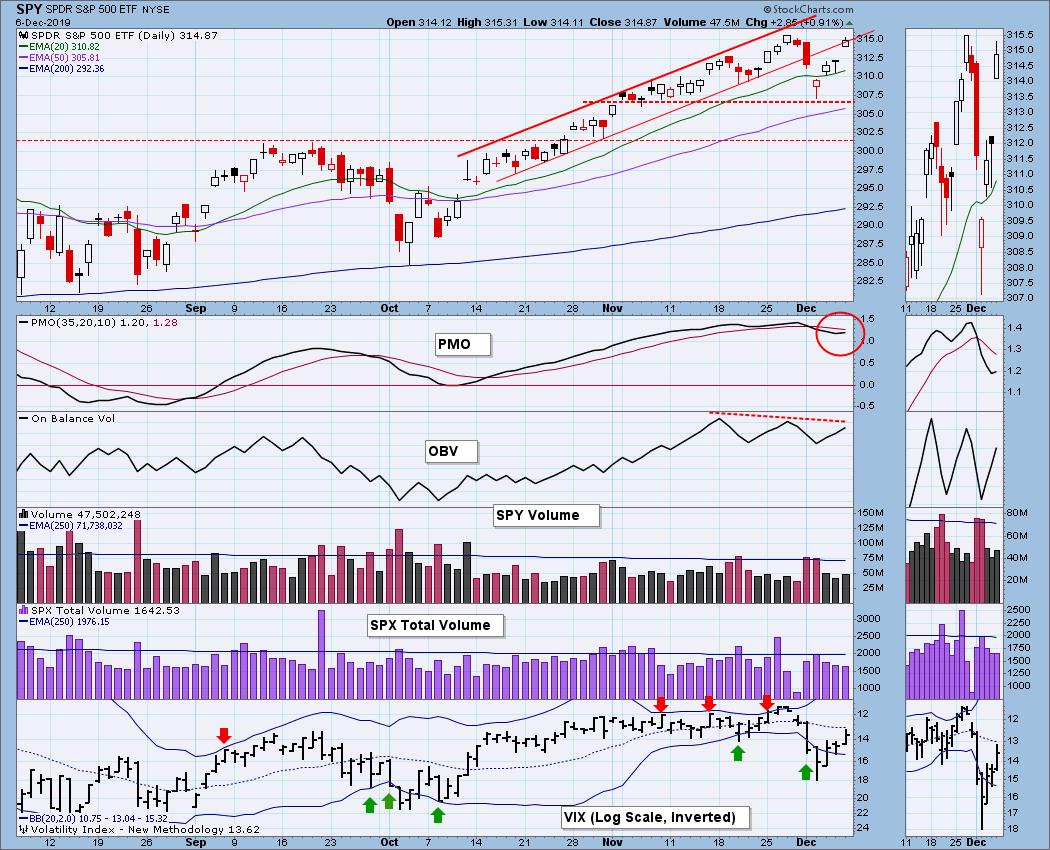
SPY Daily Chart: A very favorable jobs report on Friday snatched a rally from the jaws of what I thought would be a continuation of the three-day down trend. The market came within a hair of making new, all-time highs, but volume a bit skinny.
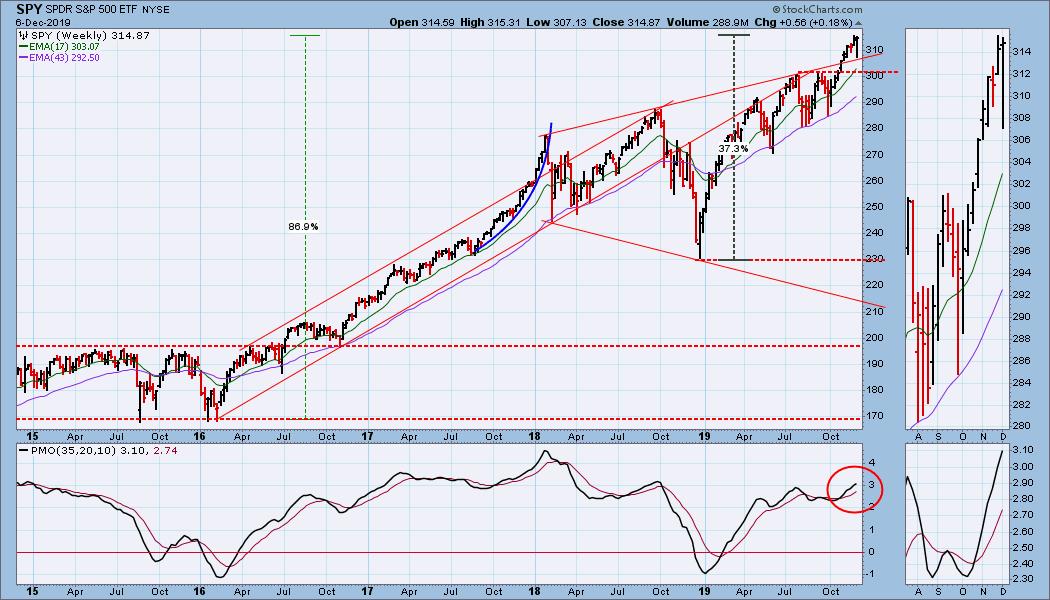
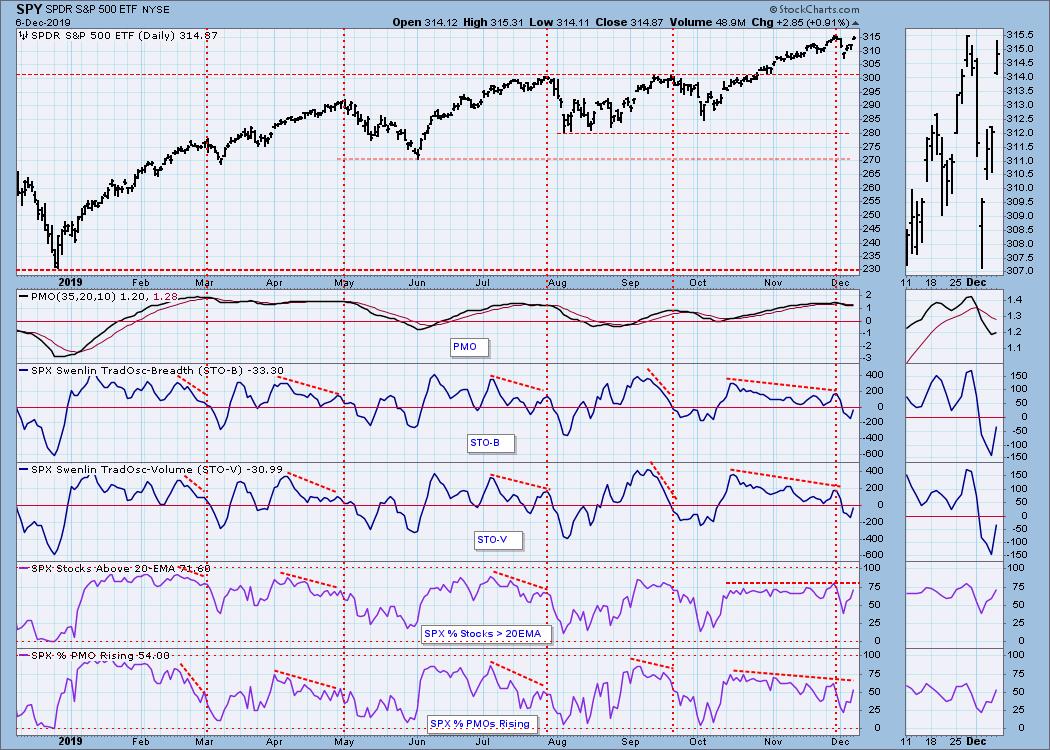
SPY Weekly Chart: SPY pulled back toward a rising tops line, which appeared to provide support; however, I think the horizontal support drawn across the mid-2019 tops is a more rational downside target for any pullback. In spite of Friday's rally, SPY was barely positive for the week.
Climactic Market Indicators: We saw climaxes in breadth and new highs, but volume was lagging.
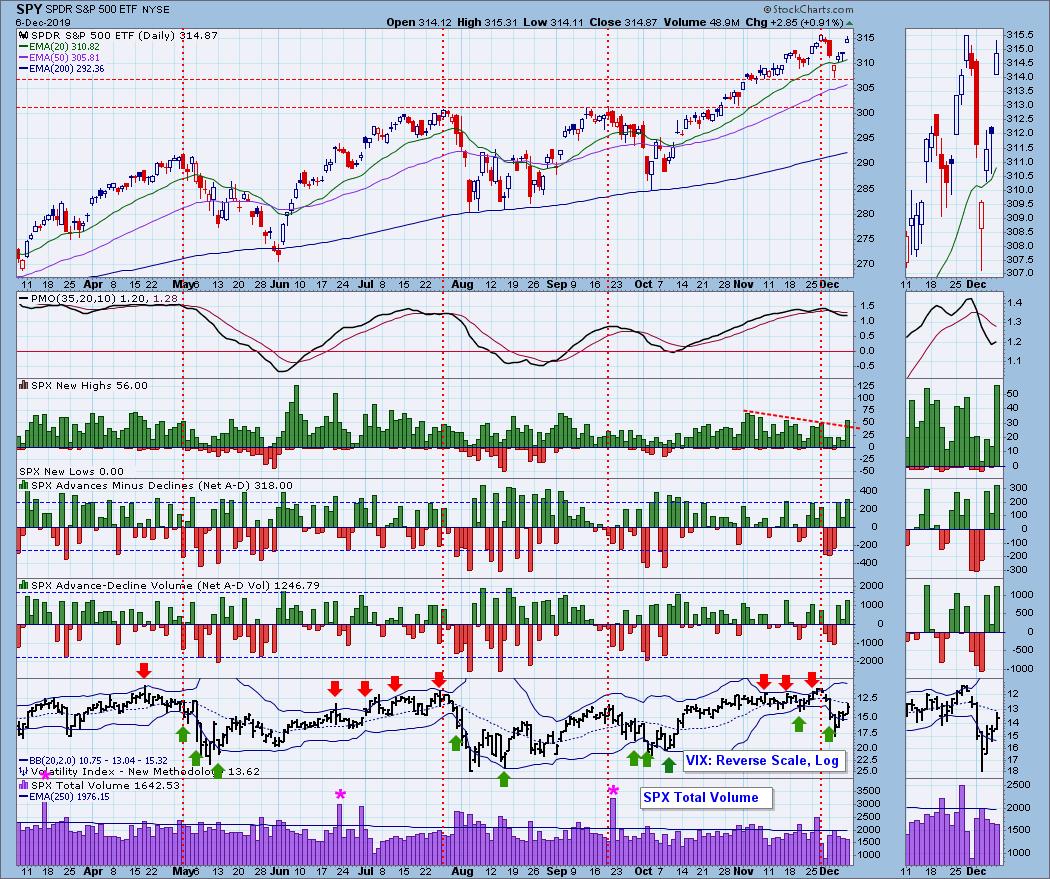
Short-Term Market Indicators: With all-time highs being challenged, I would expect these indicators to be near the top of their range. There is plenty of room before they are overbought, but I think the real issue is that they are weaker than they should be.
Intermediate-Term Market Indicators: As I said earlier, the Silver Cross negative divergence is a problem.
Negative divergences persist in this time frame.
CONCLUSION: The trend is up and the market condition, based upon the IT chart above, is somewhat overbought. Negative divergences persist, and volume is not confirming the rally. Going forward, that is a problem. Before Friday's news pop, I swear the market was headed lower. Let's see if there is upside follow through next week. My guess is that we will see another all-time high, but the week will close lower. There is a Fed meeting announcement on Wednesday when any decision will be announced. Currently, I'm not expecting any interest rate changes, but stay tuned for "best guesses" in the news early next week.
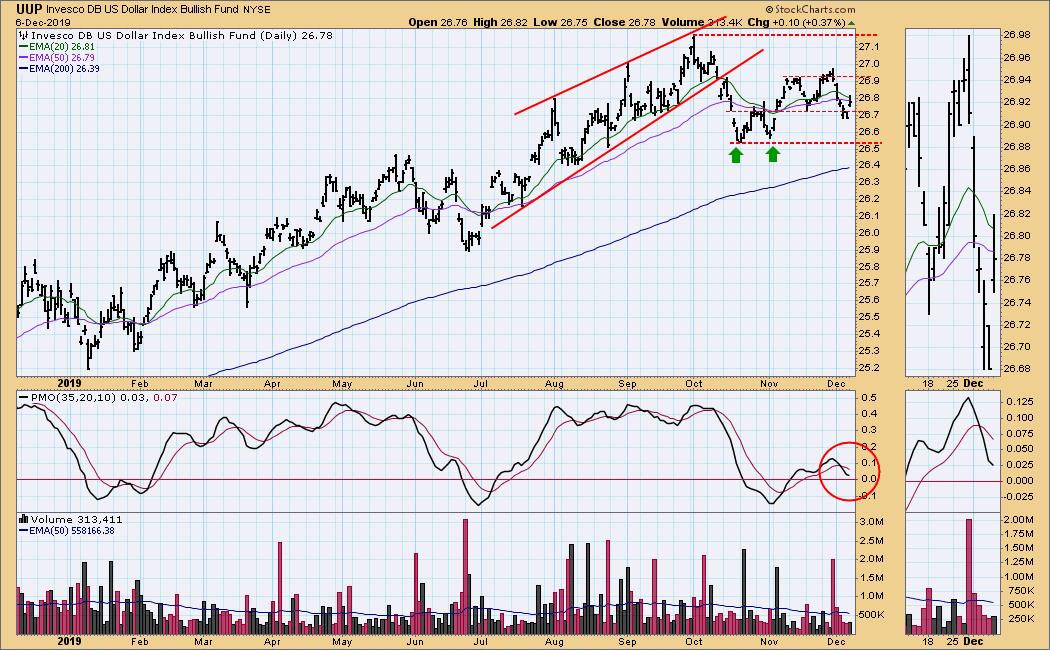
DOLLAR (UUP)
IT Trend Model: BUY as of 11/7/2019
LT Trend Model: BUY as of 5/25/2018
UUP Daily Chart: Price seems to be in a trading range with the top set by the October high and the bottom set by the October/November double bottom.
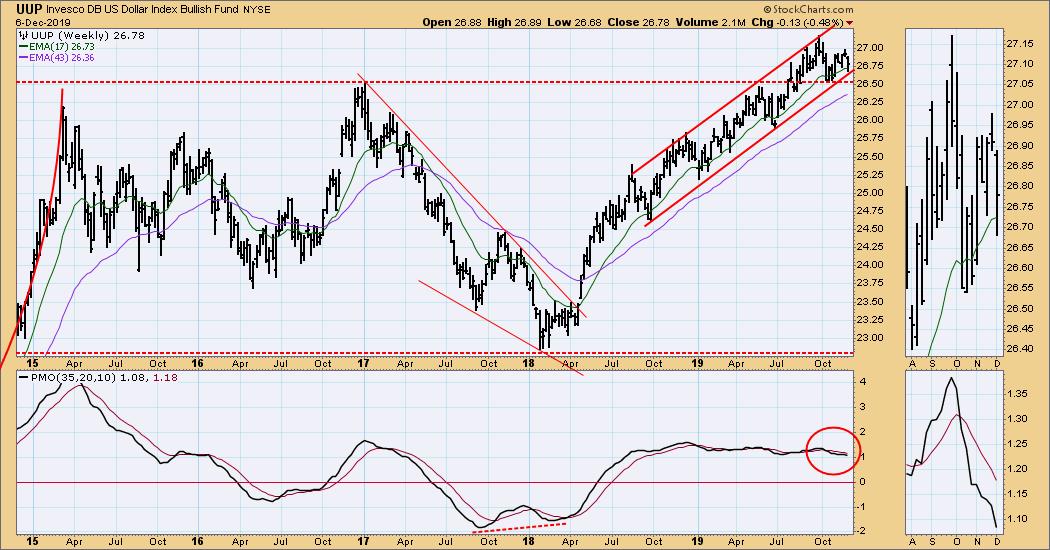
UUP Weekly Chart: The rally off the rising trend line failed before the top of the channel was reached. This implies that the trend line may fail during the current retest.
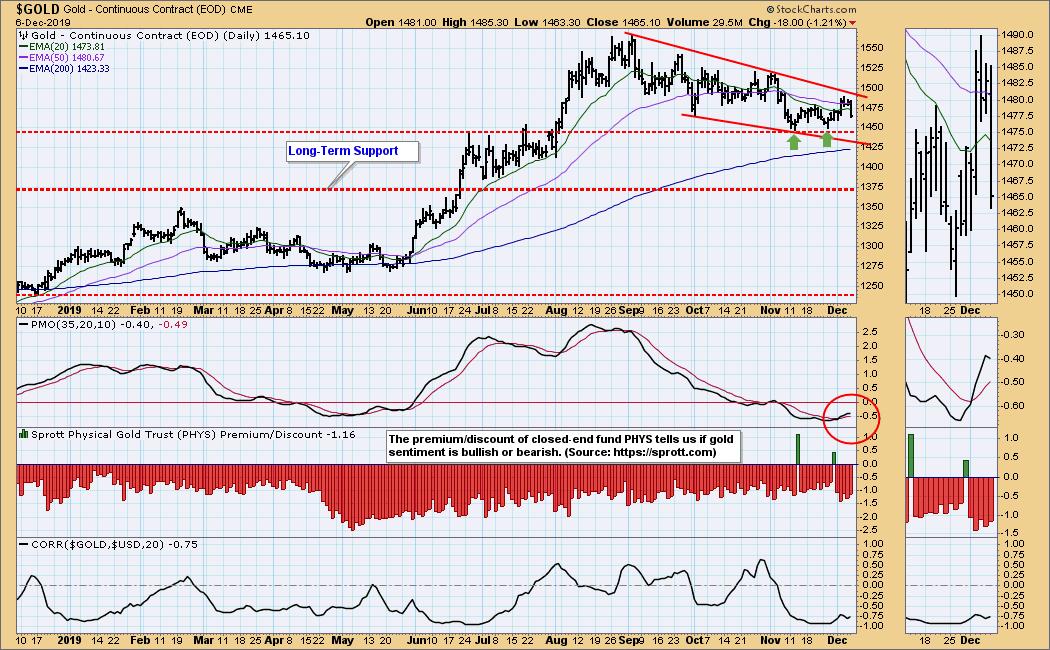
GOLD
IT Trend Model: NEUTRAL as of 11/8/2019
LT Trend Model: BUY as of 1/8/2019
GOLD Daily Chart: A promising move off a double bottom fizzled Friday as gold headed back toward support at 1445. Should that support fail, the next support is at 1375.
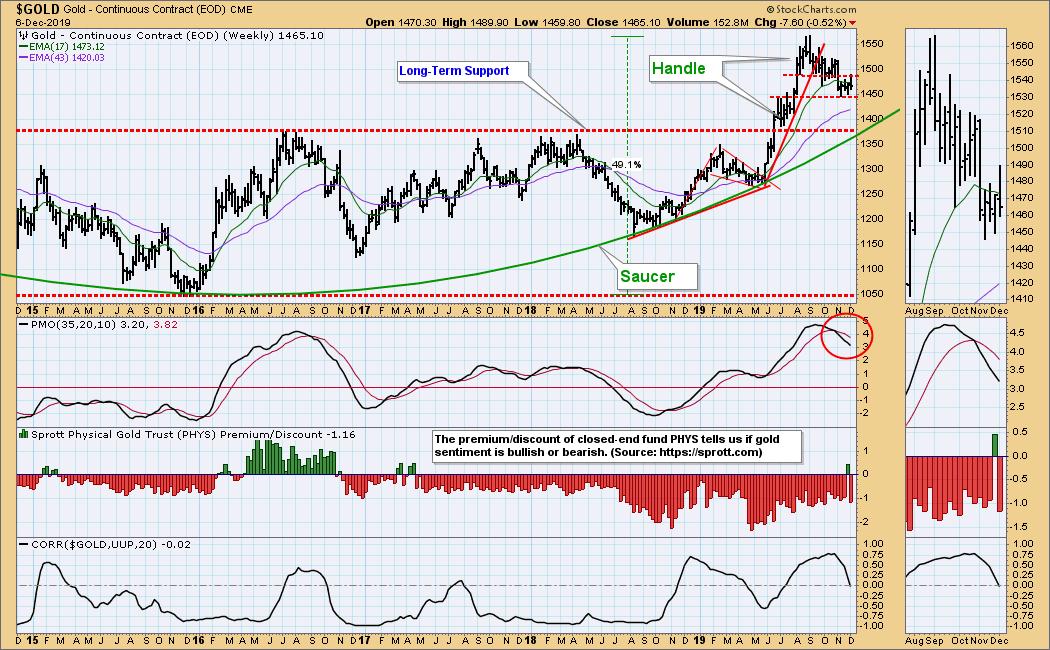
GOLD Weekly Chart: Gold is still forming the handle on a long-term bullish saucer.
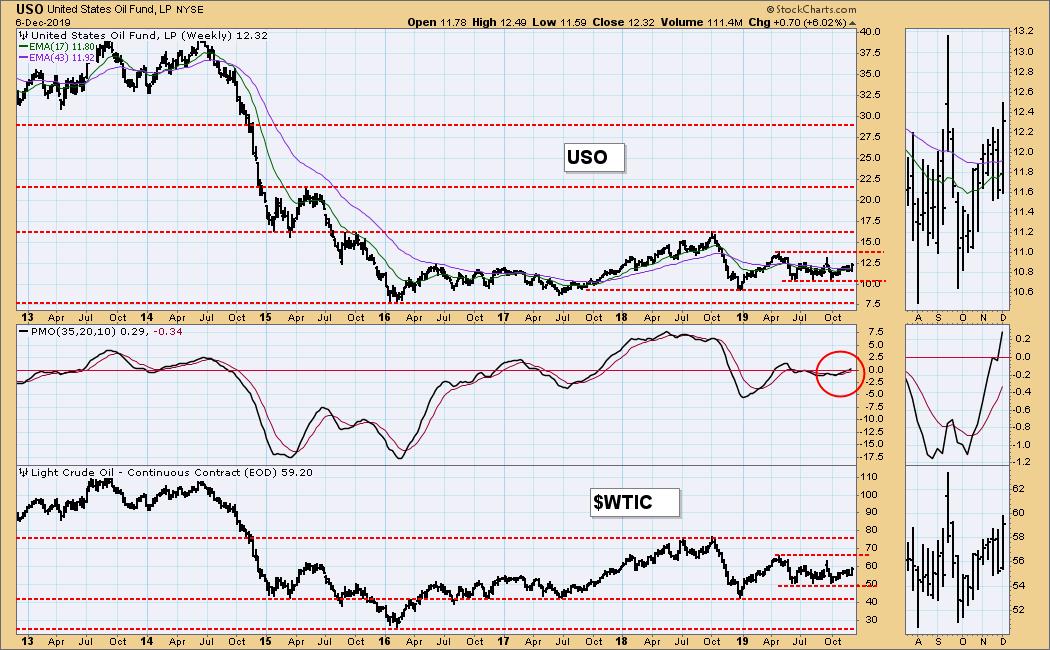
CRUDE OIL (USO)
IT Trend Model: BUY as of 11/6/2019
LT Trend Model: SELL as of 6/4/2019
USO Daily Chart: Price has been drifting toward the top of the narrowest trading range. I do not expect that range to be vacated unless it is propelled by news.
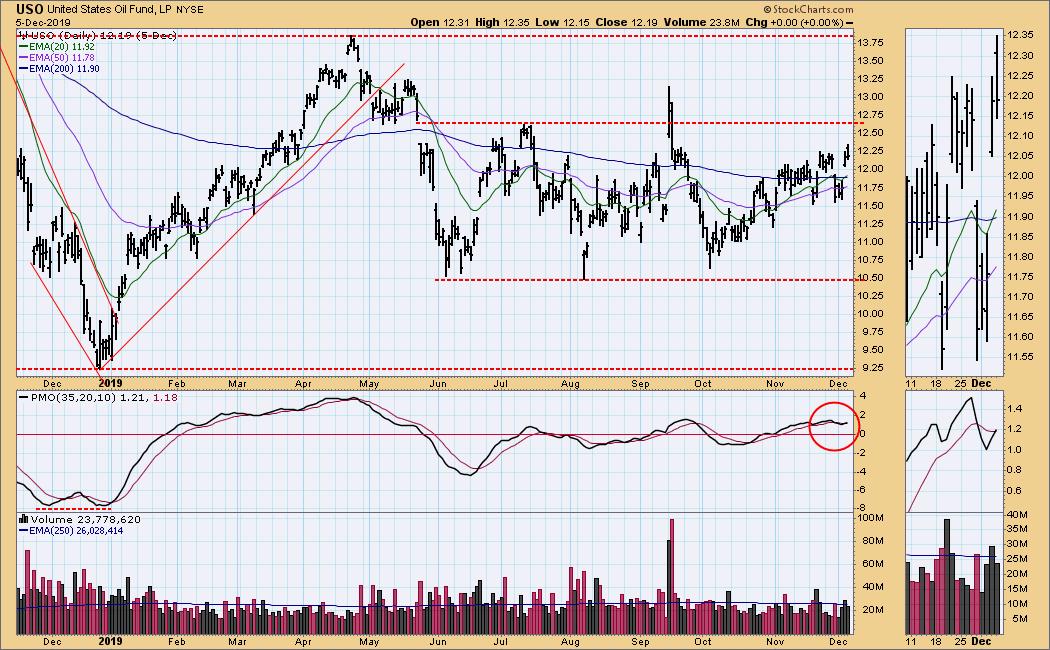
USO Weekly Chart: The weekly PMO has been flat and on the zero line since May. Expect more of the same.
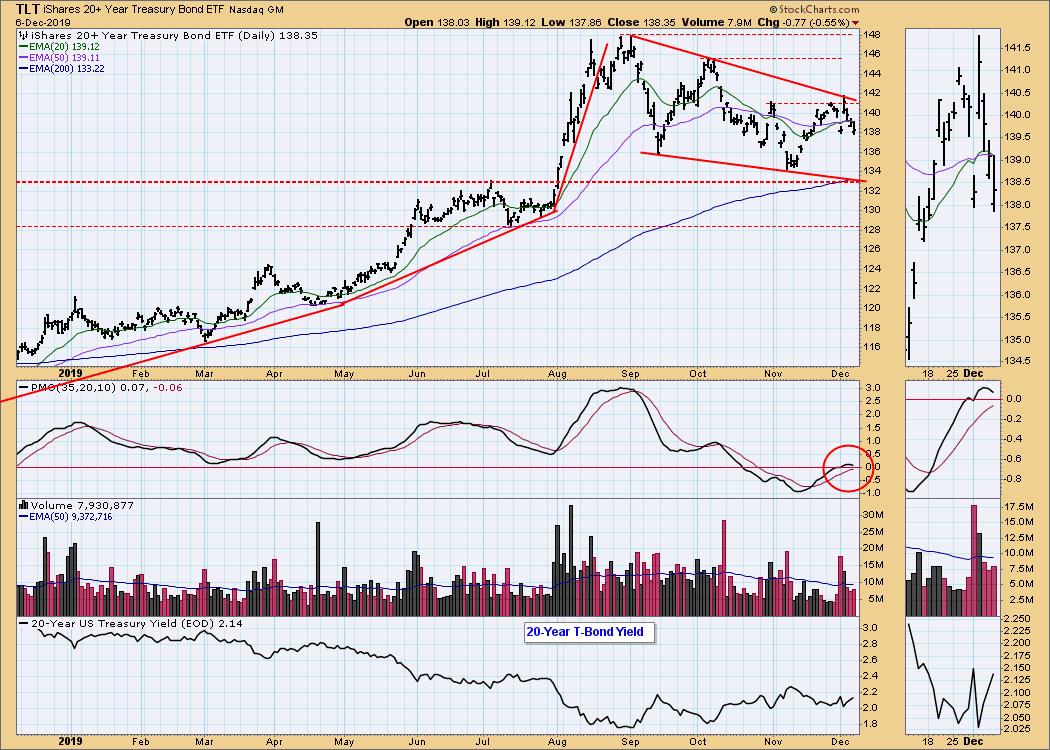
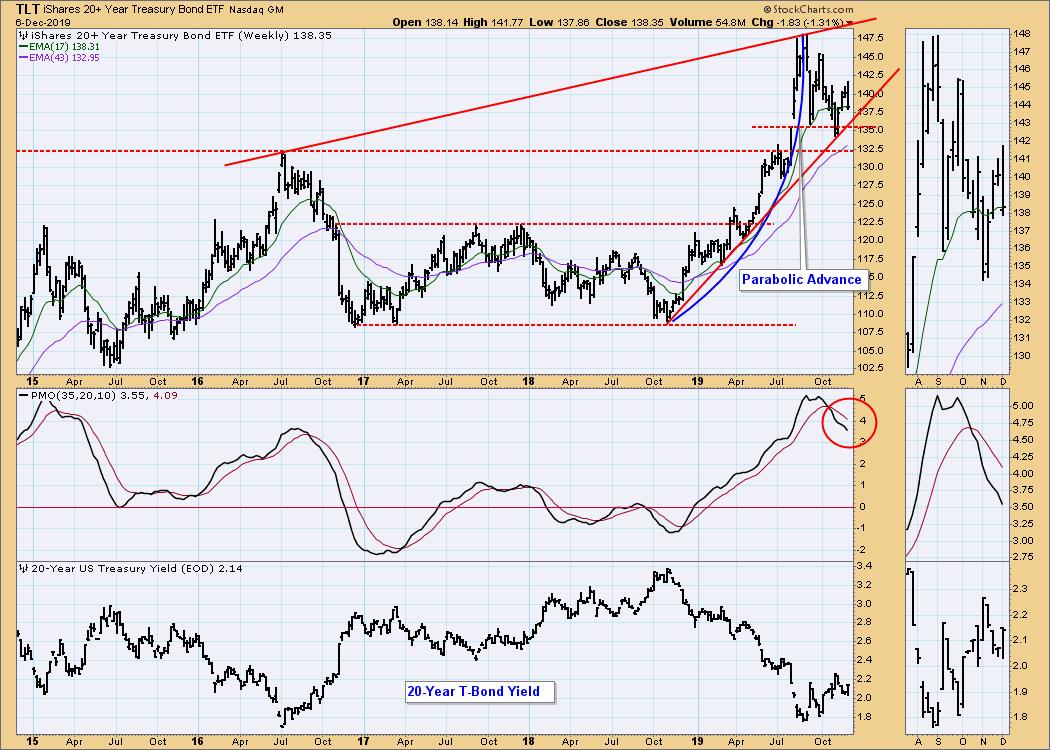
BONDS (TLT)
IT Trend Model: BUY as of 12/3/2019
LT Trend Model: BUY as of 1/2/2019
TLT Daily Chart: The dominant feature is a falling wedge, but it is not very tight, and it may take a while to resolve. The sideways price movement has the 20EMA and 50EMA very close together, so whipsaw signals will be a plague until an up or down trend engages.
TLT Weekly Chart: There has been a short parabolic advance, followed by a move back to the rising trend line. The bounce off that line seems to be over, so we should expect the trend line to be tested again.
**Don't miss any of the DecisionPoint commentaries! Go to the "Notify Me" box toward the end of this blog page to be notified as soon as they are published.**
Technical Analysis is a windsock, not a crystal ball.
Happy Charting! - Carl
NOTE: The signal status reported herein is based upon mechanical trading model signals, specifically, the DecisionPoint Trend Model. They define the implied bias of the price index based upon moving average relationships, but they do not necessarily call for a specific action. They are information flags that should prompt chart review. Further, they do not call for continuous buying or selling during the life of the signal. For example, a BUY signal will probably (but not necessarily) return the best results if action is taken soon after the signal is generated. Additional opportunities for buying may be found as price zigzags higher, but the trader must look for optimum entry points. Conversely, exit points to preserve gains (or minimize losses) may be evident before the model mechanically closes the signal.
Helpful DecisionPoint Links:
DecisionPoint Shared ChartList and DecisionPoint Chart Gallery
Price Momentum Oscillator (PMO)
Swenlin Trading Oscillators (STO-B and STO-V)