RRG Charts February 22, 2022 at 04:18 PM

In this edition of StockCharts TV's Sector Spotlight, I take on the rotations in asset classes and US sectors as they unfolded last week. Because it is the last Tuesday of the month, a look at seasonality, in combination with current rotations, is also on the menu... Read More
RRG Charts February 16, 2022 at 08:46 AM
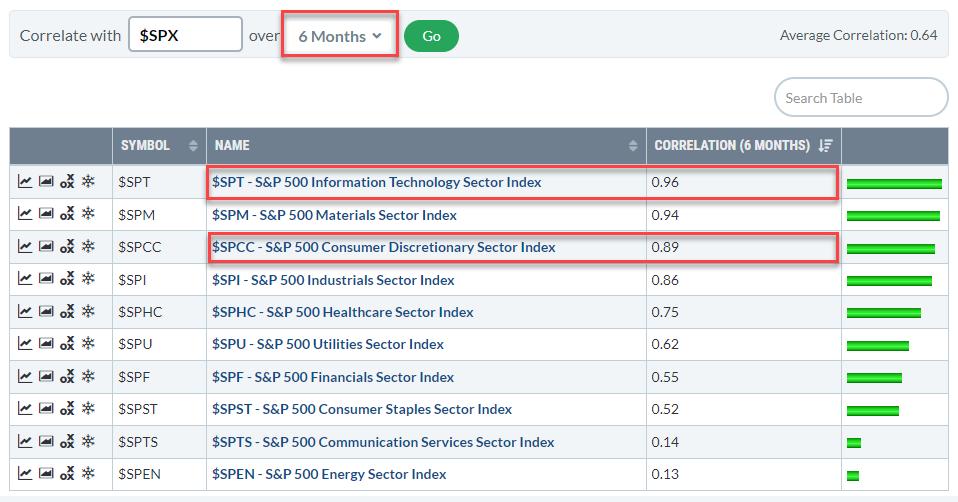
Correlation is a useful metric to use when trying to gauge the direction of the market. The table above shows the correlations for the 12 sectors against the S&P 500... Read More
RRG Charts February 15, 2022 at 04:23 PM
In this edition of StockCharts TV's Sector Spotlight, I go over last week's rotations in Asset Classes and Sectors and put these into a weekly perspective. In the Asset Class section, I zoom in on Stocks, Bonds and Commodities... Read More
RRG Charts February 10, 2022 at 11:38 AM
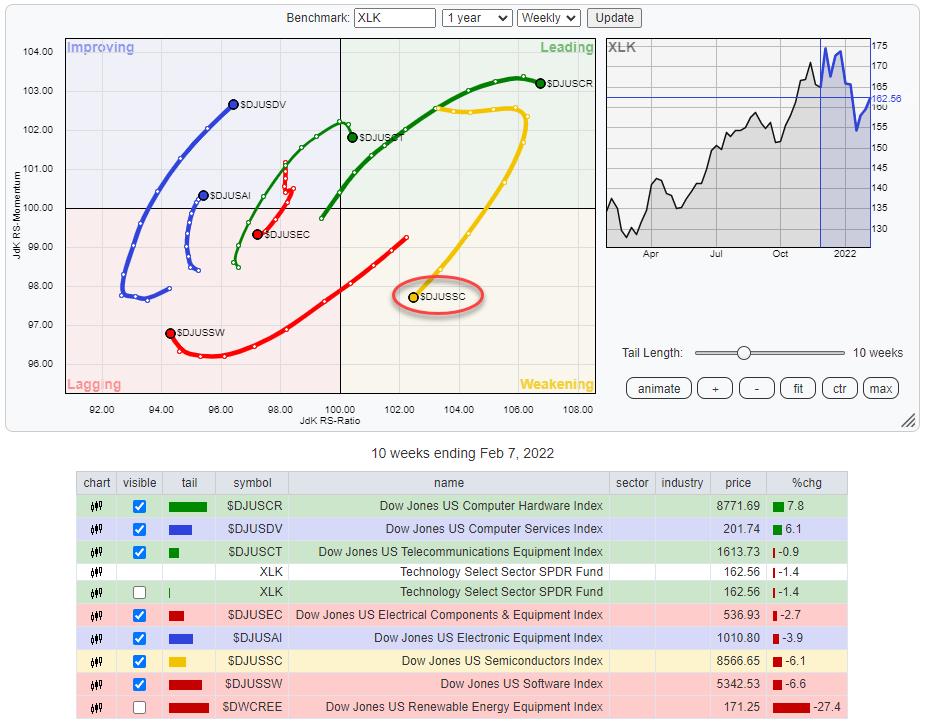
The Technology sector is under pressure for a few weeks already. We have seen a few attempts to bounce back but, so far, these have not been very successful. The Relative Rotation Graph above shows the groups within the technology sector... Read More
RRG Charts February 08, 2022 at 02:46 PM
In this edition of StockCharts TV's Sector Spotlight, after last week's look at long-term trends on monthly charts, I focus on daily and weekly rotations as I see them in asset classes and sectors. In the asset class segment, developments in the bond markets play a key role... Read More
RRG Charts February 03, 2022 at 09:25 AM
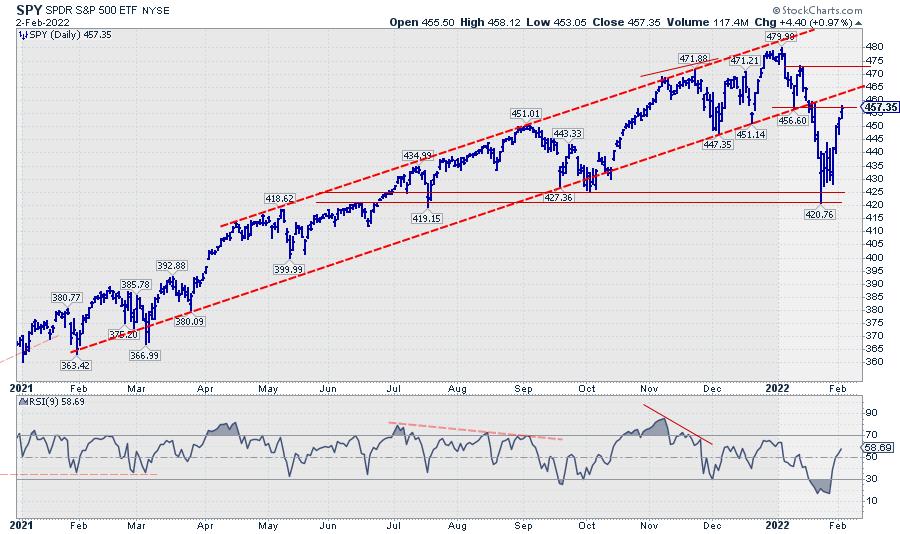
Big drops call for big recoveries, but it's dangerous to watch these moves in isolation. The S&P 500 dropped roughly 60 points from its peak at 480 at the start of the year to find a low recently around 420. Out of that low, the market rallied 40 points... Read More
RRG Charts February 01, 2022 at 04:34 PM
In this edition of StockCharts TV's Sector Spotlight, after a volatile week in the markets and the completion of the monthly charts for January on Monday (1/31), now is a perfect moment to take a good look at the developments on these long-term charts... Read More