The chart below is a chart labelling some of the QE that has gone on in the biggest economies. Notice the green is the US monetary policy and most of the US monetary policy action is on the left side of the chart. The only red box shows when the US QE ended. Currently the other three major economic areas of Asia and Europe are applying more stimulus and it dominates the right side of the chart.
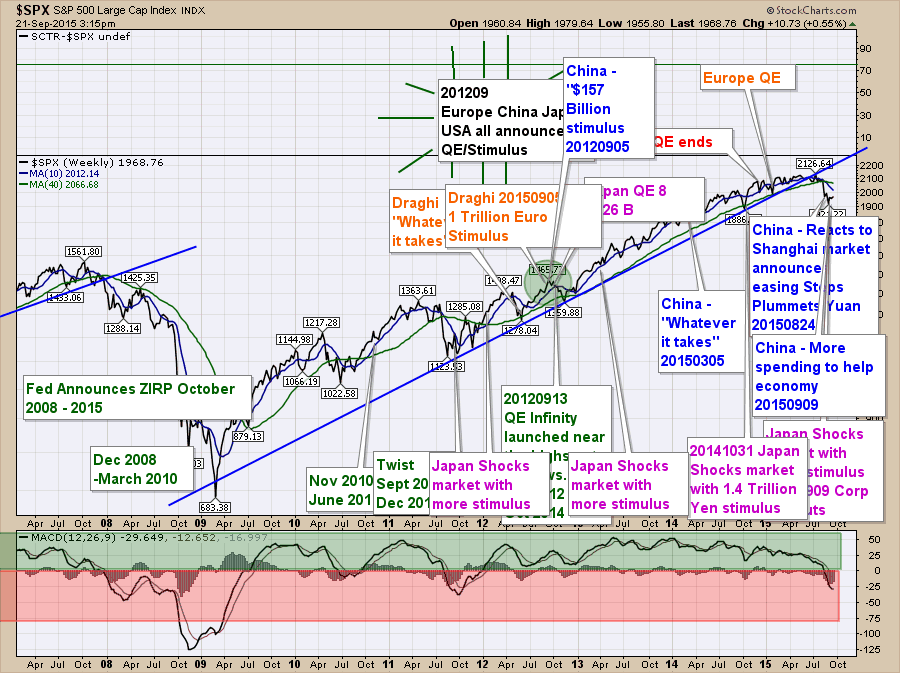
Click here to see the larger version of the chart. That will make it more readable.
The bottom line is that contrary to the perception of everything is fine, the Fed chose not to move. Why? I think the chart above is telling us there are bigger problems in the world and we can see the recent action by 3 central banks has not been able to stop the downward path of the markets.
Last week Japan's debt was downgraded to A+ from AA- by S&P. Fitch and Moodys had already done a downgrade this year. While this is not a problem yet, it is another signal of stepping down the road of failure for Abenomics to restart Japan's economy.
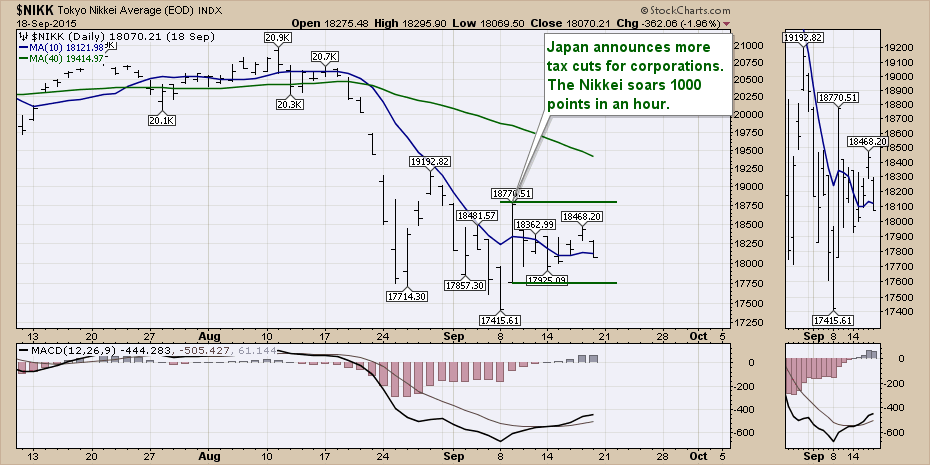
The real question is what happens if people stop believing the pink boxes of more shocking monetary policy in Japan mean anything? That's becoming more 'On-The-Table'. Here we are three years from the big September 2012 push where all four banks generated stimulus. Now Japan and China have announced more stimulus in September and Europe still has a massive QE program going on. Using 2012 as an analogy this should be bullish for the markets. We'll watch closely to see if it works, but the European markets have already fallen 25% at their lows while the massive stimulus was in place. Every Hedge Fund manager who follows monetary policy is buried in Japan and Europe. If these markets continue to let go, it's going to create some serious pressure to sell, almost proving them wrong. The bulls and bears are really fighting right here to create a trend. Japan has gone almost two weeks without making a new high or a low below the day of the announcement. This candle with the 1000 point day is now a reference candle. When the market breaks out of that range, that will be an important candle to track price action against. Below is bearish, above bullish.
Here is the long-term view of the $NIKK. There is good reason to be concerned right here. Notice how the $NIKK does not roll over at tops. It looks more like Wiley Coyote cliffs. Is this a response due to the immense pain the Japanese investing community has felt by holding too long in a deflationary environment? They appear to sell quickly and ask questions later.
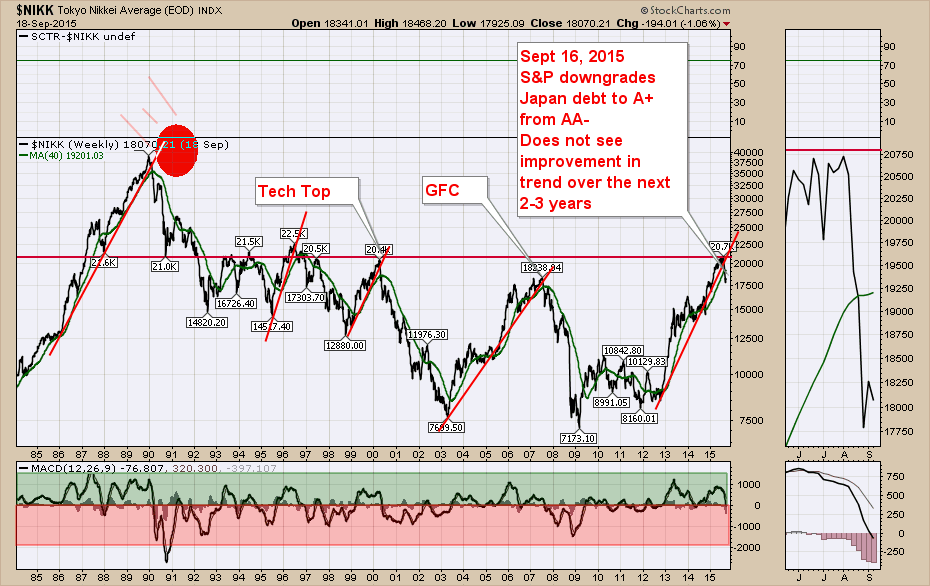
The MACD has gone below zero. It doesn't mean the end, but it does suggest to exercise extreme caution. The Japanese 10 year pays 0.37% annual interest. Parking your money may not pay much, but it's better than losses. Japan represents the third largest economy in the world.
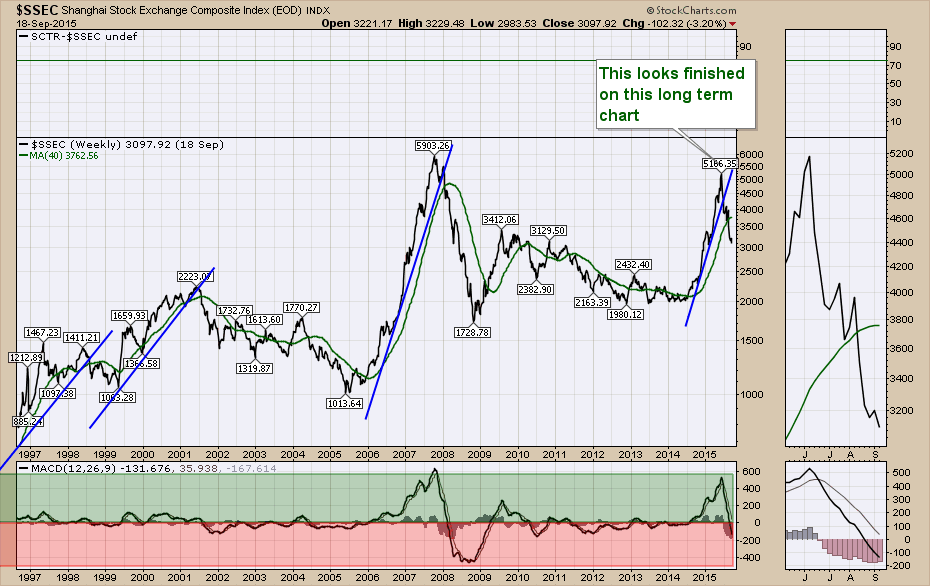
Here is the Chinese Shanghai Market ($SSEC). This trend line is broken and the market is down 40%. China represents the second largest economy in the world.
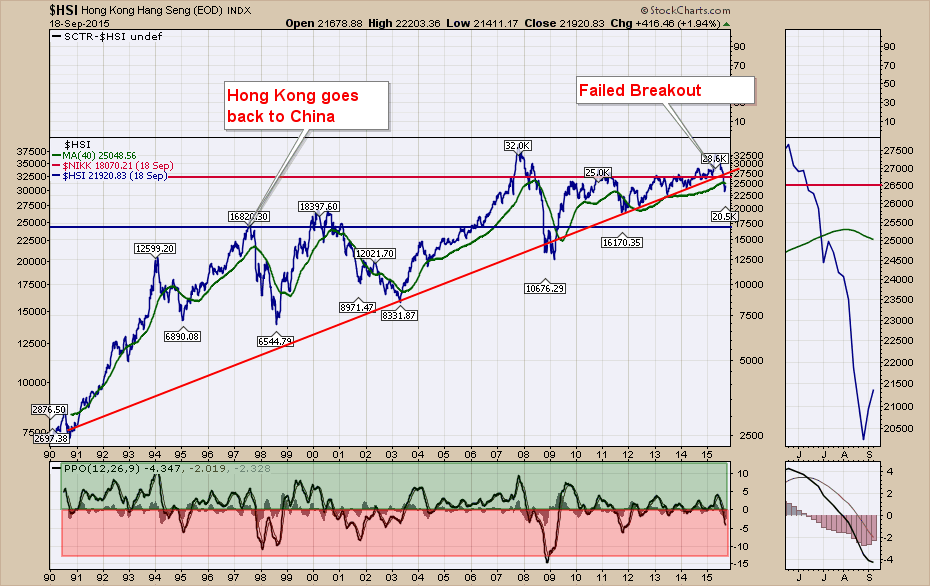
Maybe the Shanghai chart doesn't matter. Let's look at the Hong Kong Market. ($HSI). This chart has three meanings to me. Recently we had a failed breakout. Martin Pring will tell us that usually means an above average move in the opposite direction. This is also the first pullback off the highs and it has already broken the 25 year trend line. The 2008-2009 lows were at the end of the correction and the line as drawn has a lot more touch points which means it means a lot more. The fact that this line has broken is a big deal to me. We are currently below the 40 week on every chart so far. July 1, 1997 was the handover from the British to the Chinese government. That line in the sand sits at 16820 and is an important historic level.
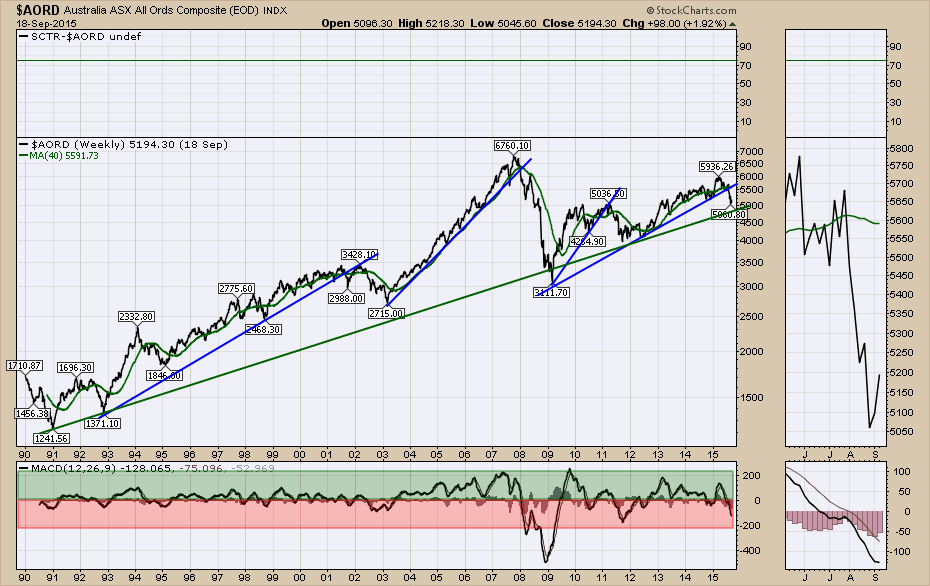
Australia looks broken. It has broken the 6-year trend line shown in blue and the 25-year trend line sits around 4800.
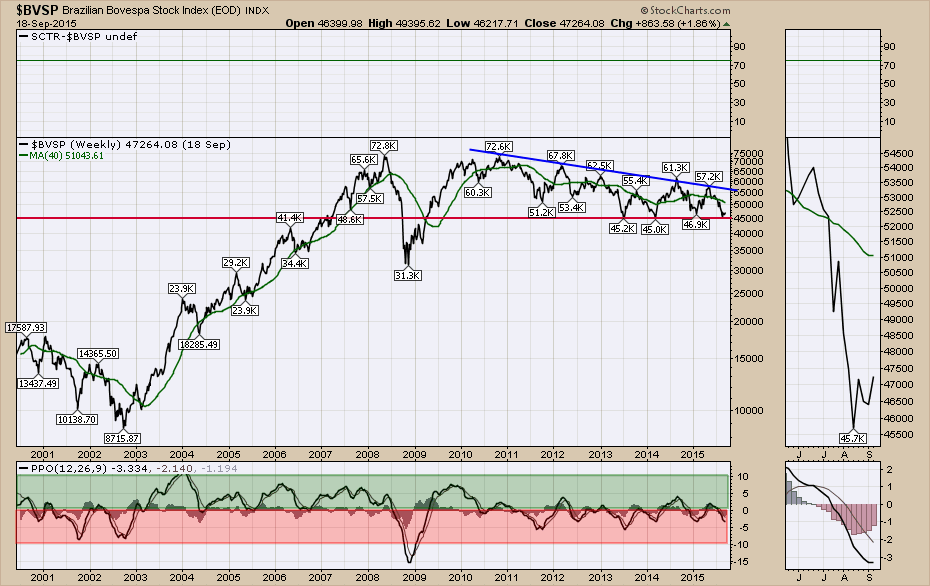
Brazil is very reliant on China to buy what they have to sell. In the chart below, the 45000 level is probably a must hold. With low oil prices this gets more difficult to hold.
Join Martin Pring and I for a webinar on Tuesday titled Market Round Up Live With Martin Pring. Register here. Feel free to forward the link to this blog to anyone you know. Thanks for helping get the word out. I'll be back on Thursday for a Commodities Countdown Webinar. See you there. You can register here. Commodity Countdown.
Good trading,
Greg Schnell, CMT
