After the violation of critical near-term support a week before, the Indian equities suffered their worst-ever weekly decline of the decade. In line with the global mayhem, the Indian stock markets also saw an equally sharp meltdown, going on to end well below the key moving average and slipping further from the broad trading pattern it had breached a week before. After swinging in a wide range of 2196 points, the NIFTY registered one of its biggest falls in absolute terms, losing 1034.25 points (-9.41%) on a weekly basis.
Amid this global mayhem and crisis that has affected most markets across the globe, it would be more helpful to traders and investors alike to take a look at the more comprehensive technical setup and understand developments with a broader perspective. We will use long-term line charts instead of candles to understand this setup as we will take the closing price for analysis.
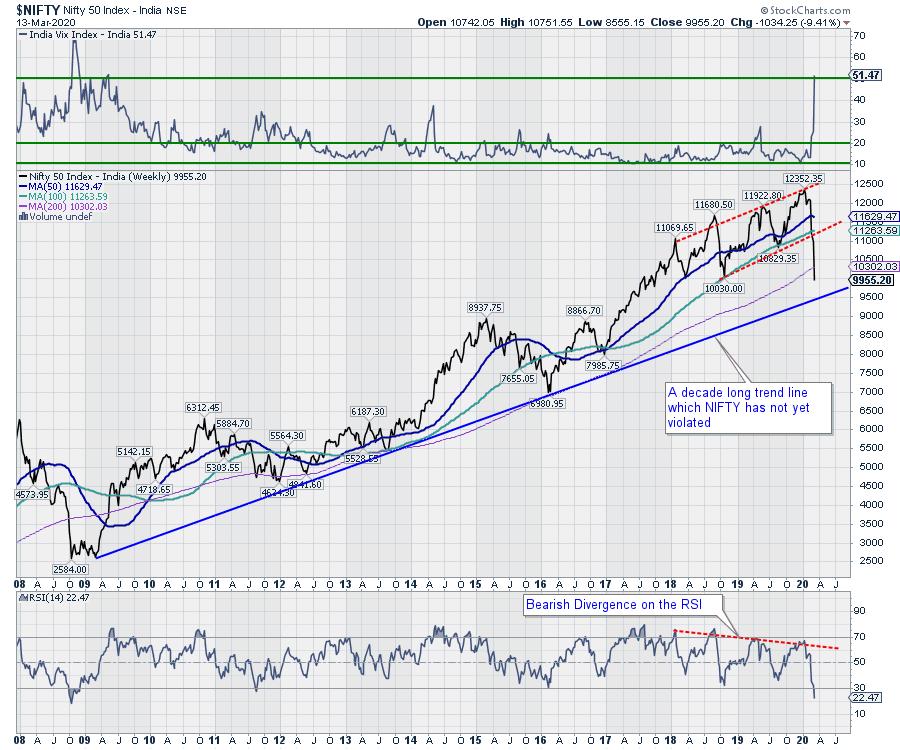
It is evident from the long-term weekly line chart that the more-than-a-decade-long uptrend has not been violated yet, despite the strong corrective move. After declining from 6397 to 2658 in 2009, the NIFTY consolidated between the 2659-3055 zones. After that, it started an uptrend and, even after 11 years, that uptrend remains in force despite the violation of key support levels.
Correction from higher levels was anticipated, but the present corrective move was swift and much more intense than expected. The NIFTY breached the broad trading pattern and the 100-week MA, which was acting as a proxy trend line a week before. In the previous week, it also breached the 200-week MA, which is currently placed at 10301.
The coming week will continue to see a shaky start to the trade. The 10300 level, which is the 200-DMA, and 10610 will act as overhead resistance in the event of a technical pullback. The support will be the trend line area, which is 9600, followed by the 9100 level.
The weekly RSI is 22.47; it has marked a fresh 14-period low, which is bearish. RSI, however, also remains neutral and does not show any divergence against the price; it is still in oversold territory. Weekly MACD is bearish and trades below its signal line.
The pattern analysis shows that, so long as NIFTY keeps its head above 9600-9700 on a closing basis, the long-term uptrend will stay intact. Any breach of this will have the potential to reverse the primary trend going forward.
From the next couple of weeks' perspective, some amount of consolidation, along with technical pullback, cannot be ruled out. However, the steep decline has brought the resistance zones much lower than before. Given the present technical setup, it will not be surprising if the NIFTY pulls back some more and oscillates in a broad 500-point range before it gives any signs of confirmation of a bottom.
We would strongly recommend not chasing the technical pullbacks as of yet. Some amount of pattern area formation and resolution on the higher side will be required for a confirmation of a temporary bottom. Short covering is likely to remain, which will bring volatility down a bit, as volatility is at its decade high. A highly stock-specific view is advised for the coming week.
Sector Analysis for the Coming Week
In our look at Relative Rotation Graphs®, we compared various sectors against CNX500 (NIFTY 500 Index), which represents over 95% of the free float market cap of all the stocks listed.


The review of Relative Rotation Graphs (RRG) shows that a defensive approach is at play in the markets. If one attempts to make purchases at the lower levels, then we have the FMCG, Consumption, IT and Pharma sectors, which are showing signs of strong relative outperformance against the broader NIFTY500 Index.
The Consumption and FMCG are seen rotating inside the improving quadrant while maintaining its relative momentum. The IT and Pharma have already entered the leading quadrant on the RRG.
Besides these sectors, which are likely to outperform the markets on a relative basis collectively, all other key sectors are seen lagging. The PSU Banks, Energy, Auto, PSE, Metals, Infrastructure, Commodities and BankNIFTY are placed in the lagging quadrant, which may cause underperformance of these sectors against the broader markets on a relative basis.
Important Note: RRG™ charts show the relative strength and momentum for a group of stocks. In the above chart, they show relative performance against the NIFTY500 Index (Broader Markets) and should not be used directly as buy or sell signals.
Milan Vaishnav, CMT, MSTA
Consulting Technical Analyst,