The unabated meltdown in the equities markets continued this week as well, which saw the NIFTY plunging to the fresh weekly lows. The Indian equities traded in line with the weak global setup and lost ground as rapidly as other global markets. The benchmark index NIFTY declined and ended in negative for the first four days of the week. Despite some short-covering-led pullback, the headline index ended with a net weekly loss of 1209.75 points (-12.75%). The currently weekly fall remains one of the largest in the absolute terms in the history of the Index.
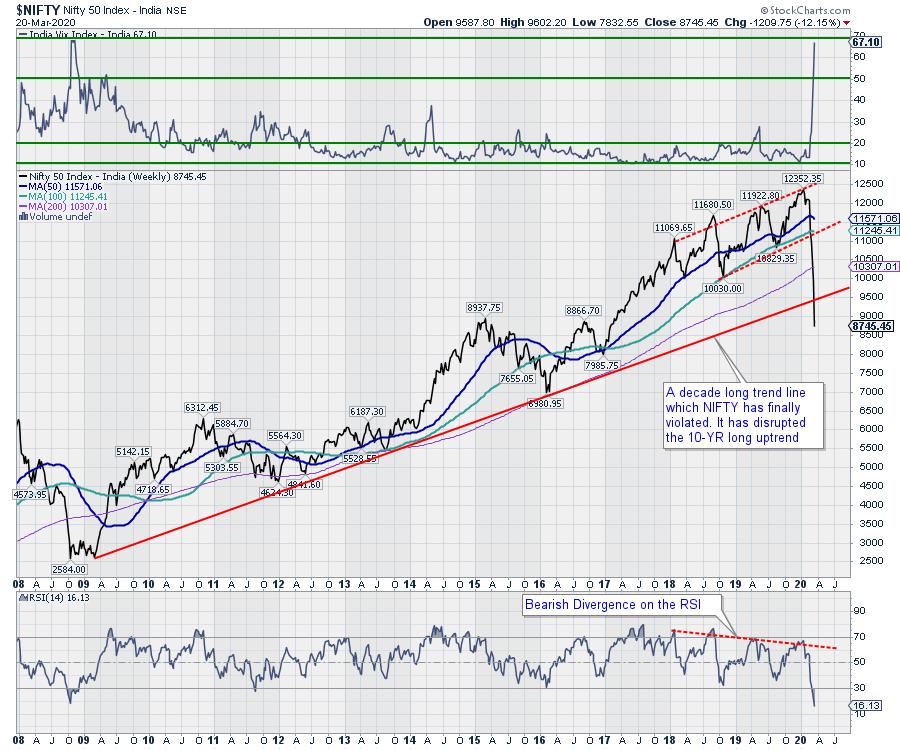
The markets have extensively damaged themselves on the technical front as of today. With the current weekly decline, the NIFTY has violated the over 10-year-long upward rising trend line as it appears on the chart. While the Index trades below all its moving averages, it is also set to very negatively react to the new Sebi circular that came out after-market hours on Friday, aiming to curb volatility in the markets. The India Volatility Index, INDIAVIX, further surged by 30.36% to 67.10, and now it trades very near to its lifetime high.
The coming week is likely to see a volatile and weak start, and the levels of 9000 and 9315 will act as resistance. The downside risks remain deeper with supports coming in at 8200 and 7800. We will see volatility remaining ingrained in the sessions over the coming days.
The weekly RSI stands at 16.13; it trades deeply oversold. The weekly RSI has marked a fresh 14-period low, which is bearish, but it remains neutral and shows no divergence against the price. The weekly MACD is bearish as it trades below its signal line. The PPO remains negative.
The pattern analysis shows that the NIFTY has violated an 11-year-old upward rising trend line. In the process, the Index has disrupted a decade-long uptrend. Speaking on the technical ground, any pullback will find resistance at this trend line going ahead.
Sebi's measures to curb shorts and, therefore, volatility, will bring in very volatile and adverse reactions from the markets. It has made creating shorts much tougher; in the process, it also reduces the amount of short-covering that usually fuels a pullback. This will result in lower volumes, lead to either margin pressure or liquidation of positions, and will also practically drive retail index traders out of the markets for a month.
We strongly recommend staying away from the current setup, as it is nearly impossible to apply technical readings in isolation on such markets. The markets will not only react to the Sebi measures, but it will also remain highly responsive to weak global markets setup as well. For medium- to long-term portfolio investors, a small amount of total available funds may be invested at lower levels, but any significant exposures should be strictly avoided.
Sector Analysis for the Coming Week
In our look at Relative Rotation Graphs®, we compared various sectors against CNX500 (NIFTY 500 Index), which represents over 95% of the free float market cap of all the stocks listed.


The review of Relative Rotation Graphs (RRG) shows that the only way to approach such weak and volatile markets is to adopt a defensive play.
Without going into microanalysis this week, as it would be pointless to do so, RRG charts convey a clear message that the defensive pockets are FMCG, Consumption, Pharma and Realty, and they are the only ones that are rotating favorably. The NIFTY Pharma, Consumption, and NIFTY IT index are the only ones in the leading quadrant. The NIFTY FMCG is presently in the improving quadrant but appears to be steadying while maintaining its relative momentum. These groups are likely to outperform the broader markets relatively.
It is best advised to stay away from the rest of the pockets in the market.
Important Note: RRG™ charts show the relative strength and momentum for a group of stocks. In the above chart, they show relative performance against NIFTY500 Index (Broader Markets) and should not be used directly as buy or sell signals.
Milan Vaishnav, CMT, MSTA
Consulting Technical Analyst,