Over the past five days, the Indian equity markets struggled to maintain their closing levels from the previous week. The beginning of the week was on a steeply negative note; the following four trading days after that were spent recouping from those lower levels. This ensured that, despite decent pullbacks, the NIFTY stayed within its range. The Index witnessed a trading range of 745 points, wider than usual. However, despite that wide range, the headline index ended absolutely flat, with a negligible gain of 18.55 points (+0.11%) on a weekly basis.
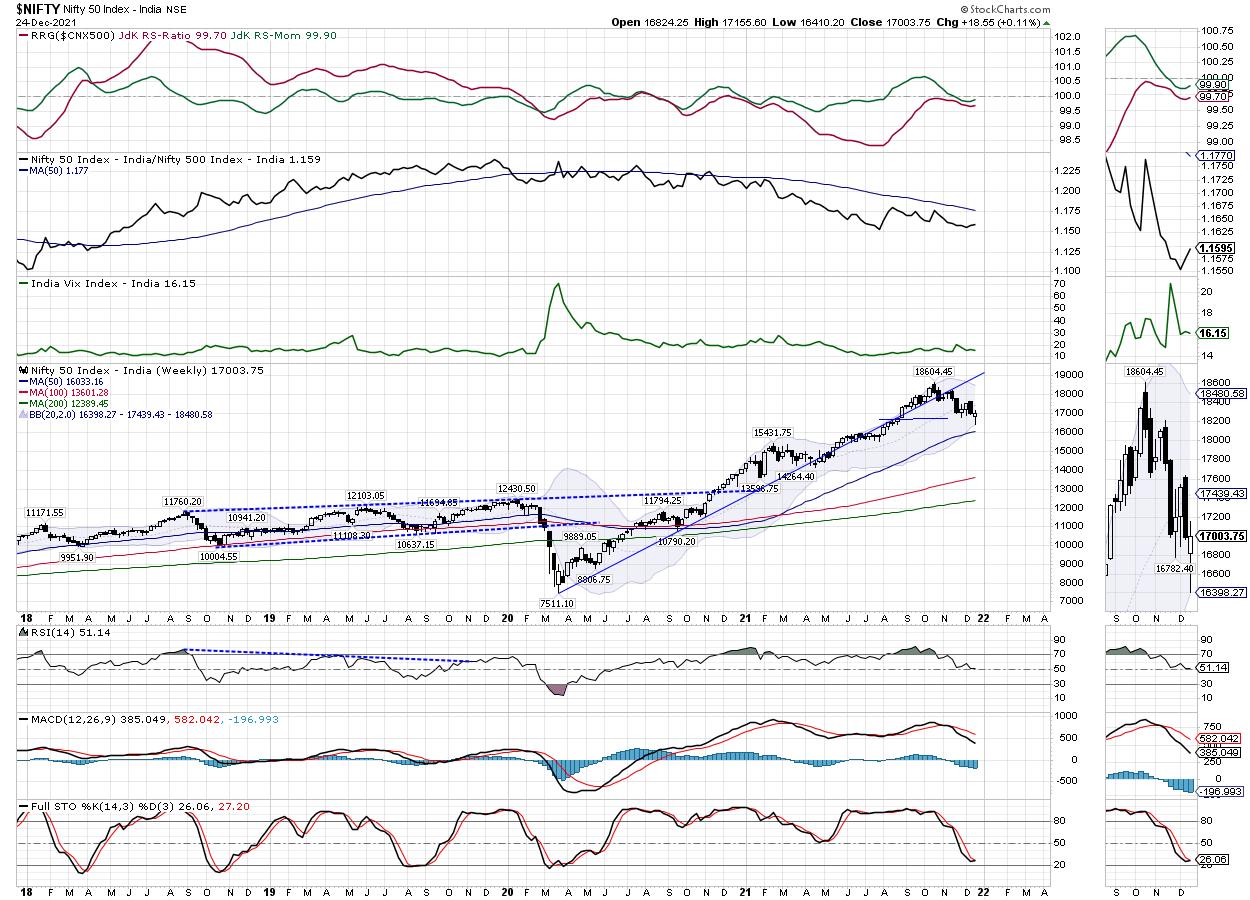
As we head into the last five trading sessions of the year, it is important to note that the NIFTY is still below the 20-Week MA, which presently stands at 17443. Beyond that, as per the weekly options data, the 17000 level continues to hold the highest PUT OI; this means that the index has support at these levels as of now. It would be crucial for NIFTY to keep its head above this point to avoid any weakness creeping in again. The most immediate resistance for the markets has been dragged lower to 17500 levels; the zone of 17150-17440 has multiple resistance points that the markets may have to deal with on daily and weekly timeframe charts.
Volatility cooled down a bit; INDIAVIX came off by 1.16% to 16.15. The coming week is likely to largely stay ranged; the overall volumes are also likely to stay modest, given the holiday season. NIFTY is likely to find resistance at the 17250 and 17400 levels. The supports are likely to come in at 16850 and 16700 levels. Just like the previous two weeks, the trading range over the coming week is also likely to stay wider than usual.
The weekly RSI is at 51.09; it shows a mild bullish divergence against the price. The weekly MACD is bearish and remains below the signal line.
A bullish hammer emerged on the candles. The candle is like the one having a "long lower shadow" and not a classical hammer, as it has an upper shadow, it can still be classified as a hammer. The occurrence of such candles after a decline and near support may hint at a potential reversal. However, we will need confirmation of this effect.
In the previous weekly technical note, I mentioned that moving past the 17000-17200 zone will be crucial for NIFTY. This holds true for the coming week as well. Moving past the 17000-17200 zone will ensure that the NIFTY ends its corrective spell and enters the broad consolidation zone once again. So long as it is below this zone, it theoretically stays vulnerable to profit-taking bouts. We will see traditionally defensive sectors like Consumption, Pharma and IT doing relatively better over the coming days. It is recommended to keep purchases modest and limited to relatively stronger pockets over the coming week.
Sector Analysis for the Coming Week
In our look at Relative Rotation Graphs®, we compared various sectors against CNX500 (NIFTY 500 Index), which represents over 95% of the free float market cap of all the stocks listed.

The analysis of Relative Rotation Graphs (RRG) shows that Nifty PSUBank, Auto, Energy, Media and the Infrastructure Indexes are inside the leading quadrant. However, they appear to be slowing down on their relative momentum. That said, these packs may continue relatively outperforming the broader NIFTY500 Index.
The NIFTY PSE Index and the Realty Index continue to slide while staying within the weakening quadrant. What is remarkable to see is the IT Index, which is showing strong rotation towards the leading quadrant while being placed inside the weakening quadrant. This reflects a sharp improvement of relative momentum in the IT Index against the broader markets.
NIFTY Pharma rolls inside the improving quadrant; this marks a potential end to the relative underperformance of this sector. NIFTY Metal is inside the lagging quadrant, but it appears to be on the verge of rolling over to the improving quadrant. NIFTY Consumption, FMCG, the Services Sector Index and the Commodities Index are inside the lagging quadrant.
NIFTY Bank is inside the improving quadrant; the relative momentum here looks to be leveling off. Broadly speaking, we will see selective and isolated outperformance from these pockets.
Important Note: RRG™ charts show the relative strength and momentum for a group of stocks. In the above chart, they show relative performance against NIFTY500 Index (Broader Markets) and should not be used directly as buy or sell signals.
Milan Vaishnav, CMT, MSTA
Consulting Technical Analyst
www.EquityResearch.asia | www.ChartWizard.ae
- For Premium Equity Portfolio Advisory on Indian Stocks, Click Here.
- Alpha-generating actionable investment ideas on the US and UK Equities, Click Here.
- For International Commodities like Gold, Crude Oil and EURUSD/GBPUSD pairs, Click Here.