Except for some intermittent consolidation, the previous five trading days largely saw the markets advancing and extending their technical pullbacks on the anticipated lines. As mentioned in the previous technical note, the high Put OI at 17000 stayed constant, which lent support to the markets all through the previous week. The markets defended and moved past some key levels on the daily charts as well over the past five days. Following a 567-point movement range, the headline index ended with a net weekly gain of 350.30 points (+2.06%).
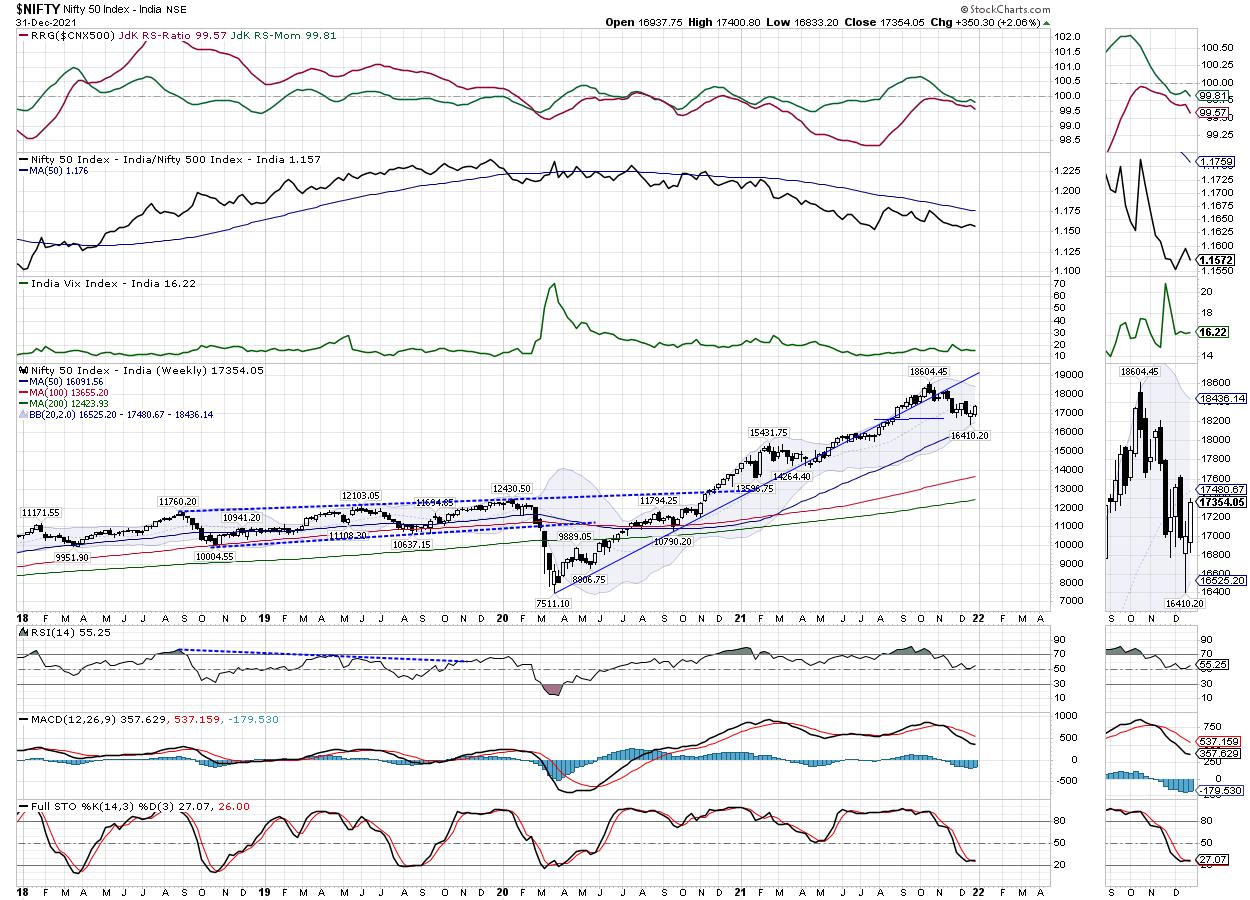
Friday was not only the last trading day of the month, but it also ended 2021 as well on a positive note. While NIFTY closed with net monthly gains of 370.85 points (+2.18%), it ended the year with YTD gains of 23.79% while outperforming the NIFTY Bank Index that returned 13.63% on a YTD basis. The NIFTY is in kissing distance of its intermediate short-term resistance, that of the 20-Week MA. This level is presently at 17485. This makes the zone of 17400-17500 an important resistance zone for the NIFTY to navigate before it further extends its move. Even the weekly options data show 17500 holding the highest Call OI as of now; this makes this point an immediate resistance for the markets. Unless this level is taken out convincingly, we will see the markets consolidate a bit around the current levels.
With major global markets closed on Monday, we are unlikely to have any major cues for Monday and Tuesday for the domestic markets. The markets are likely to ring into the new year on a quiet note. For the coming week, the levels of 17500 and 17655 acting as resistance points. The supports will come in at 17280 and 17035 levels. The trading range over the next five days will be modest, but the markets may see some ranged oscillations during the week.
The weekly RSI is 55.21; it remains neutral and does not show any divergence against the price. The weekly MACD is bearish and trading below the signal line. A large white candle emerged; this reflects the directional consensus of the market participants on the upside. Given that this strong and bullish candle appeared following a hammer, this further reinforces the credibility of the support zone of 16400-16500 in the near term.
The pattern analysis of the weekly chart shows that, despite an intra-week violation of 16650-16700 levels, this basing area of the Index was largely defended, with the markets crossing above this point. By and large, 16700 remains a critical level to watch over the coming weeks. Staying above this will keep the markets under broad consolidation; violation of this point will be structurally damaging on the charts.
As we head into the fresh week of the new year, we expect the markets to display underlying buoyancy. We may see some continued lack of participation due to the holidays; this may also cause some intermittent range-bound consolidations. However, it is recommended that you avoid shorting the markets at current levels. All downsides that may come as a part of consolidation must be used to make select purchases. A cautiously positive outlook is advised for the coming week.
Sector Analysis for the Coming Week
In our look at Relative Rotation Graphs®, we compared various sectors against CNX500 (NIFTY 500 Index), which represents over 95% of the free float market cap of all the stocks listed.

The analysis of Relative Rotation Graphs (RRG) shows that the NIFTY Metal index has rolled inside the improving quadrant. This hints at the resumption of some good moves in relative terms from this sector. The PSUBANK, Media, Auto, Media and Energy Sectors are inside the leading quadrant. However, they all appear taking a breather and consolidating.
The NIFTY IT index is seen making strong moves and is about to enter the leading quadrant. Apart from this, NIFTY Infrastructure and Realty Indexes are inside the weakening quadrant. NIFTY PSE has rolled inside the lagging quadrant.
FMCG Index is also inside the lagging quadrant; however, it appears to be improving on its relative momentum. NIFTY Bank has slipped again inside the lagging quadrant.
NIFTY Pharma, along with the Metal Index, has rolled inside the improving quadrant, but is seen making stable moves. These groups will continue to improve their relative performance against the broader markets. Some isolated moves from the Financial Services sector, Commodities and Consumption moves cannot be ruled out.
Important Note: RRG™ charts show the relative strength and momentum for a group of stocks. In the above chart, they show relative performance against NIFTY500 Index (Broader Markets) and should not be used directly as buy or sell signals.
Milan Vaishnav, CMT, MSTA
Consulting Technical Analyst
www.EquityResearch.asia | www.ChartWizard.ae