The Indian equity markets extended their up move for this week as well and ended with gains. The NIFTY gained for the first three trading sessions, then consolidated in the last two sessions of the week. The market continued to display its internal strength and looks forward to defending its recent technical pullback, seen over the past several days. The week that went by saw the Index oscillating in a 561.40-point range. While the NIFTY stayed above key levels on the daily charts, it went past important levels on the weekly charts. The headline index finally ended with a net gain of 458.65 points (+2.64%) on a weekly basis.
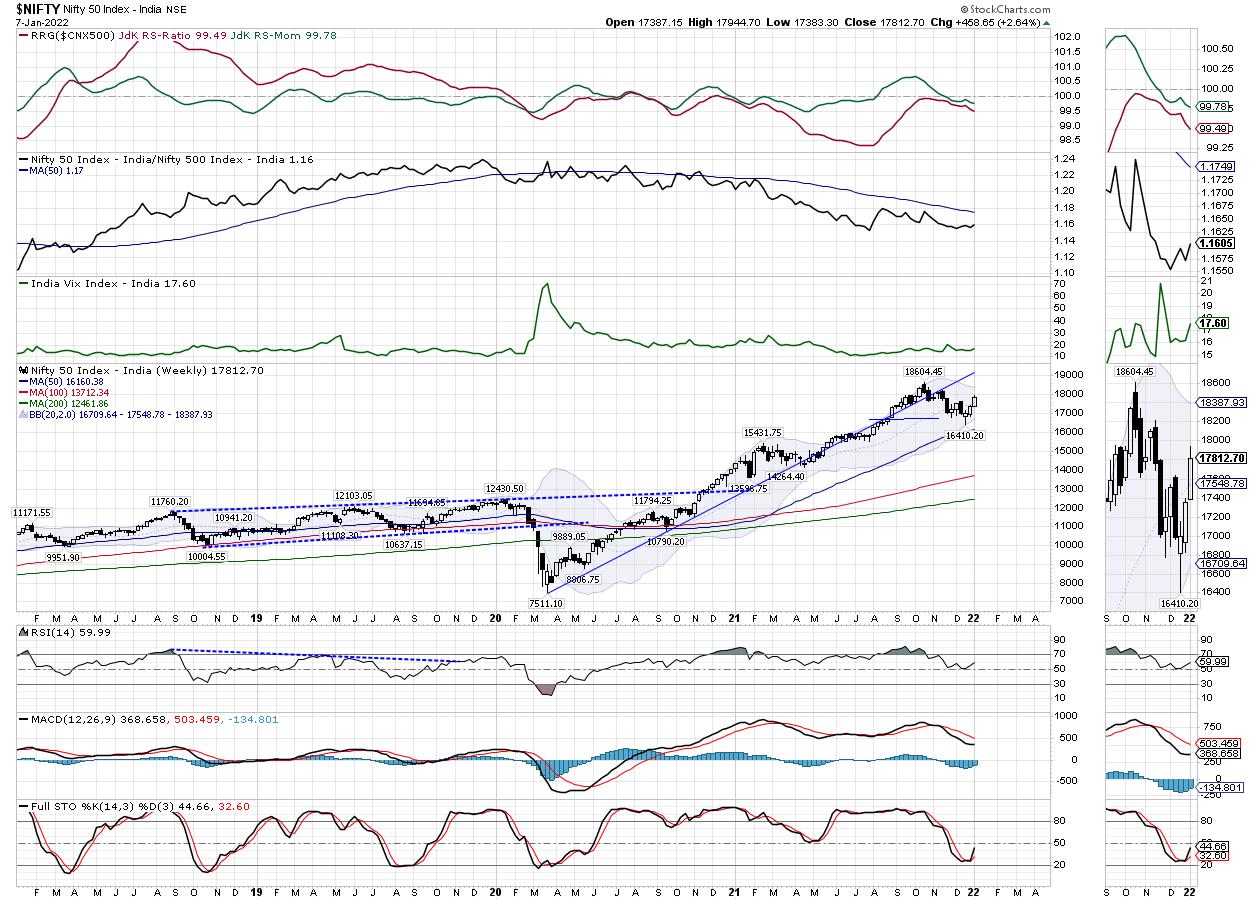
Over the past several days, the strikes of 18000 continue to see the maximum accumulation of the Call OI. This level will continue to act as resistance unless taken out convincingly. On the other hand, the highest PUT OI stands at 17500; this defines the likely trading range over the coming week. From a technical perspective, it is important to note that the NIFTY has moved past and crossed above the 20-Week MA, which presently stands at 17553. There is some chance that the markets consolidate in general with an inherently bullish undertone. Volatility increased, INDIAVIX climbed by 8.51% to 17.60.
The coming week is likely to see the levels of 18000 and 18080 acting as resistance points. The supports come in at the 17710 and 17565 levels. There remains a chance of the markets witnessing ranged oscillations over the coming days.
The weekly RSI is 59.96; it remains neutral and does not show any divergence against the price. The weekly MACD is bullish and stays above the signal line. A strong white candle emerged; this showed the directional consensus of the market participants throughout the week.
The pattern analysis of the weekly charts shows that, following a formation of a candle with a long lower shadow, the NIFTY found a base for itself as it defended a crucial 16650-16700 zone. In the process, the Index also took support at the lower Bollinger band; after this, a strong technical followed, which took the markets higher.
As we head into the new week, there is a higher chances that the markets consolidate within a broad but defined range. Any runaway up move is unlikely unless the NIFTY moves past the 18000 levels convincingly. On the other hand, even downsides are likely to remain ranged and limited. Some consolidation, if at all it happens, should not come as a surprise, as it would make the recent 1500-point technical pullback healthier and more sustainable. It is recommended to avoid shorts and use all opportunities to make select purchases while protecting profits at higher levels.
Sector Analysis for the Coming Week
In our look at Relative Rotation Graphs®, we compared various sectors against CNX500 (NIFTY 500 Index), which represents over 95% of the free float market cap of all the stocks listed.

The analysis of Relative Rotation Graphs (RRG) shows that there is no material change in the sectoral setup as compared to what was seen in the previous week. The NIFTY PSU Bank, Media and Auto groups are inside the leading quadrant. They appear to be taking a breather and paring on their relative momentum front.
The IT Index has moved inside the leading quadrant again. Along with the above groups, it may now start relatively outperforming the broader NIFTY500 Index. The NIFTY Energy Index has slipped inside the weakening quadrant. The Realty Index, MIDCAP 100 Index, Infrastructure, and Services Sector Indexes are also inside the weakening quadrant. However, the tails do not show any major directional change this week over the previous week.
The NIFTY Financial Services Index continues to languish in the lagging quadrant along with BankNifty, despite strong moves in the previous week. The NIFTY FMCG, Consumption and Commodities groups are inside the lagging quadrant as well, but they are improving their relative momentum against the broader markets.
The Metals and the Pharma indexes are inside the improving quadrant. They are likely to continue relatively outperforming the broader markets.
Important Note: RRG™ charts show the relative strength and momentum for a group of stocks. In the above Chart, they show relative performance against NIFTY500 Index (Broader Markets) and should not be used directly as buy or sell signals.
Milan Vaishnav, CMT, MSTA
Consulting Technical Analyst
www.EquityResearch.asia | www.ChartWizard.ae