It was a week of consolidation; a positive consolidation, in fact, where the markets oscillated in a broad range before closing the week with mild gains. The NIFTY saw itself trading in a 511-point range, as compared to the 690-point range in the week before this one. In the last five sessions, the NIFTY stayed in the broad 15700-16400 trading range, but ended near the upper edge while it consolidated. Apart from this, the markets have stayed in this range for three weeks in a row now; they are making visible attempts to inch higher. Following a wide-ranging five sessions, the headline index closed with a net gain of 86.30 points (+0.53%) on a weekly basis.
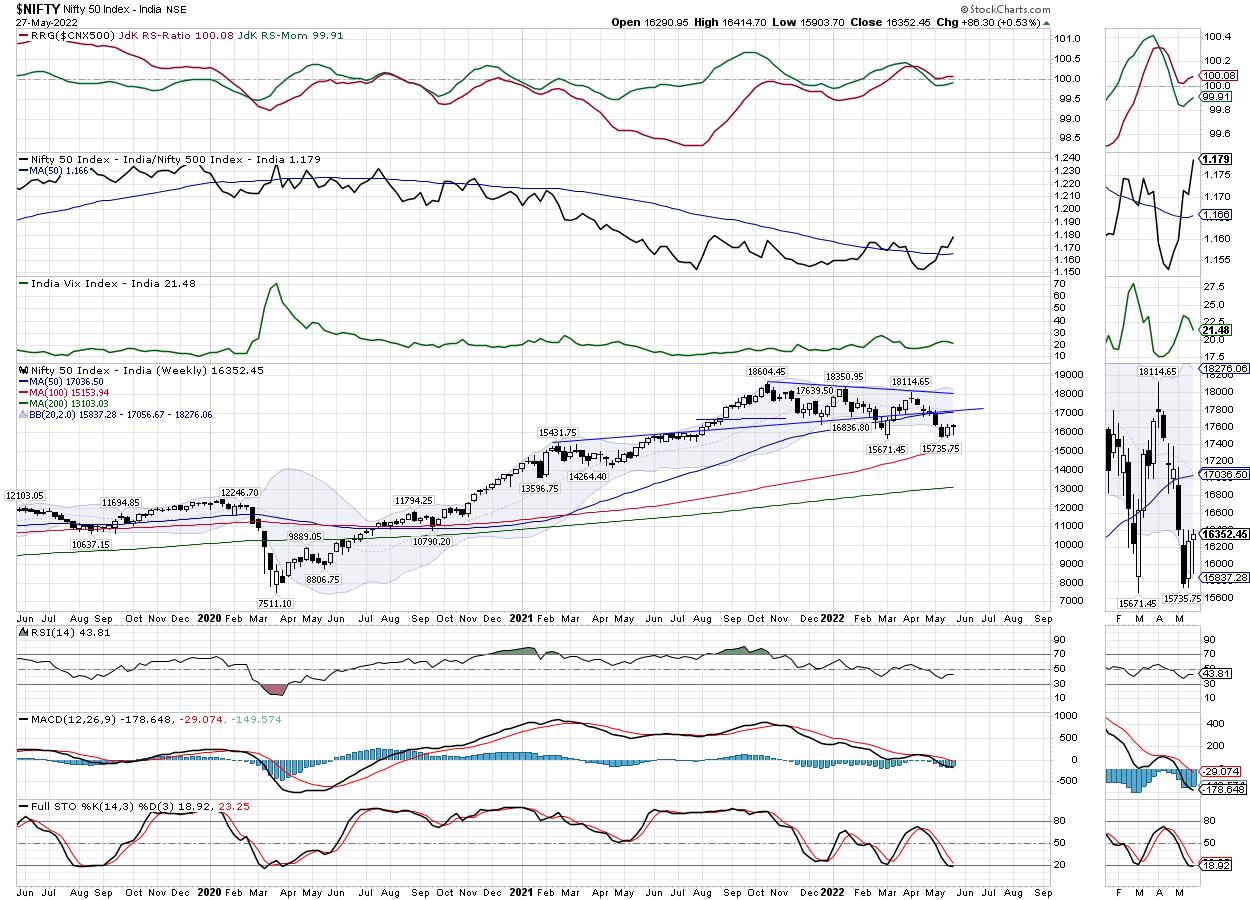
The low point of 15735 has held itself for the third week in a row; it also defends the double bottom support that the NIFTY has taken in the 15670-15735 range. While the markets try hard to find a base for themselves and move higher, there is a greater chance of the NIFTY testing its 50-Week Moving Average, which is presently at 16918. However, to do this, it will have to negotiate a gap between 16450-16625 and move past that potential resistance zone, which will require global cues to stay positive and not offer any weak overnight developments. Besides this, volatility declined; INDIAVIX declined by 7.01% to 21.48.
The coming week is expected to see the levels of 16500 and 16650 acting as potential resistance points. The supports come in at 16200 and 16000 levels. The trading range is expected to continue to stay wider than usual.
The weekly RSI is 43.80; it continues to stay neutral and does not show any divergence against the price. The weekly MACD is bearish and below the signal line. The histogram gap is seen narrowing; this may take the indicator towards a positive crossover in the coming weeks.
A candle with a long lower shadow occurred. Apart from a small upper body, this looks like a bullish hammer. The occurrence of such a candle near the support area following a decline makes a good case for a potential formation of a reversal point for the markets subject to confirmation.
The pattern analysis shows that the NIFTY has held on to the double bottom support that exists in the zone of 15670-15750. So long as this zone is protected, we have greater possibilities of the NIFTY trying to extend its technical pullback.
Some pockets like Realty, Financials, IT, etc. are seen improving their relative performance against the broader markets. NIFTY's Relative Strength line against the NIFTY 500 is rising and above the 50-DMA; the frontline index likely continues to do well. We are also likely to see improved performance from the NIFTY bank, which has been underperforming the broader markets. Overall, if supported by the absence of negative global cues, the coming week may see some healthy moves by the equity markets.
Sector Analysis for the Coming Week
In our look at Relative Rotation Graphs®, we compared various sectors against CNX500 (NIFTY 500 Index), which represents over 95% of the free float market cap of all the stocks listed.

The analysis of Relative Rotation Graphs (RRG) shows that major pockets of the sectors are showing improved relative strength and momentum against the broader markets. NIFTY Infrastructure, PSE, Pharma, Infrastructure, Media, FMCG, Consumption, Commodities and Energy are inside the leading quadrant. All these sectors are likely to show relative outperformance against the broader NIFTY500 Index.
The NIFTY Metal index has rolled inside the weakening quadrant; this hints at a likely end to relative outperformance of this sector against the broader markets. NIFTY PSU Bank stays inside the weakening quadrant, but shows improvement in the relative momentum against the broader markets.
NIFTY Bank, which is inside the lagging quadrant, is also showing a sharp upturn and improvement in the relative momentum along with the NIFTY Financial Services index. The NIFTY Services sector index and the IT index continue to languish inside the lagging quadrant.
NIFTY Realty Index has rolled inside the improving quadrant; this means that a phase of relative outperformance of this sector against the broader markets may begin.
Important Note: RRG™ charts show the relative strength and momentum for a group of stocks. In the above Chart, they show relative performance against NIFTY500 Index (Broader Markets) and should not be used directly as buy or sell signals.
Milan Vaishnav, CMT, MSTA
Consulting Technical Analyst,
www.equityresearch.asia | www.chartwizard.ae