The five sessions over the previous week were gripped with insane volatility; four out of five days saw the NIFTY gapping either on the up or on the downside. The wild moves are not reflected on the weekly charts, but the close examination of the daily chart made this behavior of the index very much apparent. In the previous weekly note, it was mentioned that the NIFTY has tested double bottom support; this support has held itself throughout the volatile week. The markets saw a 690-point trading range, quite similar to the week before this one. Finally, after a strong short covering-led rally on the last trading day, the NIFTY ended with net gains of 484 points (+3.07%) on a weekly basis.
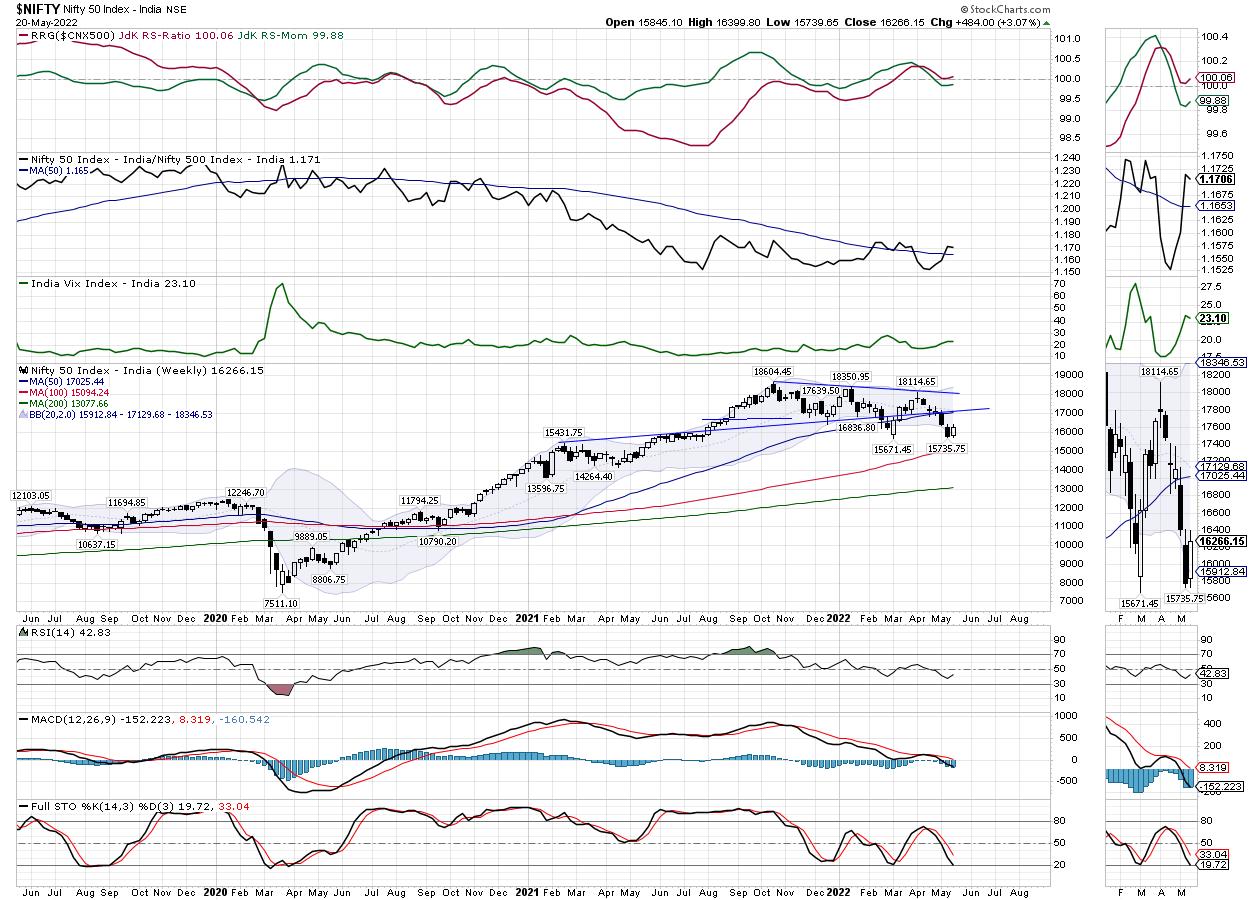
Despite strong gaps on the up or the downside, the volatility remained largely unchanged on a weekly basis; it just came off by 1.64% to 23.10. More importantly, from a technical perspective, the NIFTY has successfully defended the double bottom support zone of the 15500-15750 area. So long as the NIFTY is above this zone, there will be a higher chance of the NIFTY stabilizing and finding a base for itself. In other words, a violation of this zone will invite incremental weakness. To translate this in simpler terms, the NIFTY's price action against the 15500-15700 zone would be crucial to watch over the coming weeks.
The coming week will also see the expiry of the current derivative series; the sessions may stay dominated by rollover-centric activities. While a stable and positive start to the week is expected, the levels of 16480 and 16670 will act as resistance points; the supports are expected to come in at 16000 and 15910 levels. The trading range will continue to stay wider than usual.
The weekly RSI is 42.82; it is neutral and does not show any divergence against the price. The weekly MACD is bearish and stays below the signal line. A white-bodied candle emerged; apart from this, no other formations were noticed on the charts.
The pattern analysis of the weekly chart shows that the NIFTY has so far respected the classical double bottom support; this support exists in the range of 15500-15750 levels. For the markets to find some foot and stability, keeping their head above the mentioned zone will be critically important for the markets.
All in all, the key to navigating the volatile markets is to have a steadfast focus on the relatively stronger pockets. We will see sectors like Consumption, Realty, PSE, and other such groups showing resilience in times of weakness and relative outperformance during the moves on the higher side. However, the markets are yet to confirm their potential bottom; it would be wise to keep leveraged exposures at modest levels and maintain a highly stock-specific and selective approach toward the markets.
Sector Analysis for the Coming Week
In our look at Relative Rotation Graphs®, we compared various sectors against CNX500 (NIFTY 500 Index), which represents over 95% of the free float market cap of all the stocks listed.

The analysis of Relative Rotation Graphs (RRG) shows that the Consumption, FMCG, Pharma, Infrastructure and the PSE indexes are likely to relatively outperform the broader markets, as they reside in the leading quadrant. The Metal, Energy and Commodity groups are also inside the leading quadrant, but they are likely to see a highly stock-specific outperformance.
The PSU Bank index continues to languish inside the weakening quadrant. The Media index is also inside the weakening quadrant, but it is seen sharply improving on its relative momentum front and moving towards entering the leading quadrant.
The NIFTY IT index and the Services sector index are inside the lagging quadrant; they are expected to relatively underperform the broader NIFTY500 index. The Realty and the Auto indexes are also inside the leading quadrant, but they are sharply consolidating their relative performance while improving on their momentum along with NIFTY Bank.
The Midcap 100 index is inside the improving quadrant; it is likely to consolidate its performance for the better.
Important Note: RRG™ charts show the relative strength and momentum for a group of stocks. In the above Chart, they show relative performance against NIFTY500 Index (Broader Markets) and should not be used directly as buy or sell signals.
Milan Vaishnav, CMT, MSTA
Consulting Technical Analyst
www.EquityResearch.asia | www.ChartWizard.ae