RRG Charts November 24, 2020 at 09:00 PM

In this edition of Sector Spotlight, I walk viewers through the current state of asset class and sector rotations... Read More
RRG Charts November 24, 2020 at 05:47 PM
The Financial sector has been picking up a lot of relative strength recently. On the Relative Rotation Graph for US sectors (against SPY), XLF is on a rotation trail through the improving quadrant and closing in on a cross over into the leading quadrant... Read More
RRG Charts November 18, 2020 at 11:54 AM

From time to time, I discuss possible long or short positions (stocks, ETFs) based on observations on Relative Rotation Graphs or ideas generated from them. Currently, the baskets contain five positions each... Read More
RRG Charts November 17, 2020 at 04:16 PM
In this edition of Sector Spotlight, I look at the performances for asset classes and sectors last week, noticing long tails on those daily RRGs - that indicates some big moves that have taken place... Read More
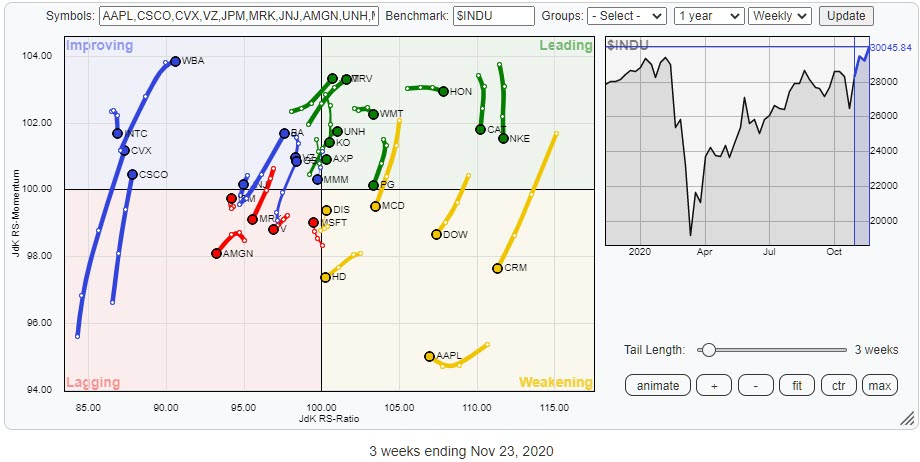
RRG Charts November 16, 2020 at 10:10 AM

There is a lot of talk lately regarding the Growth to Value rotation that seems to be going on. And if you look at the surface, that is certainly true, but there is more to it than meets the eye..... Read More
RRG Charts November 10, 2020 at 08:00 PM
In this edition of Sector Spotlight, I look at asset class and sector rotation after last week's elections and try to digest the impact for various sectors... Read More
RRG Charts November 10, 2020 at 03:22 PM
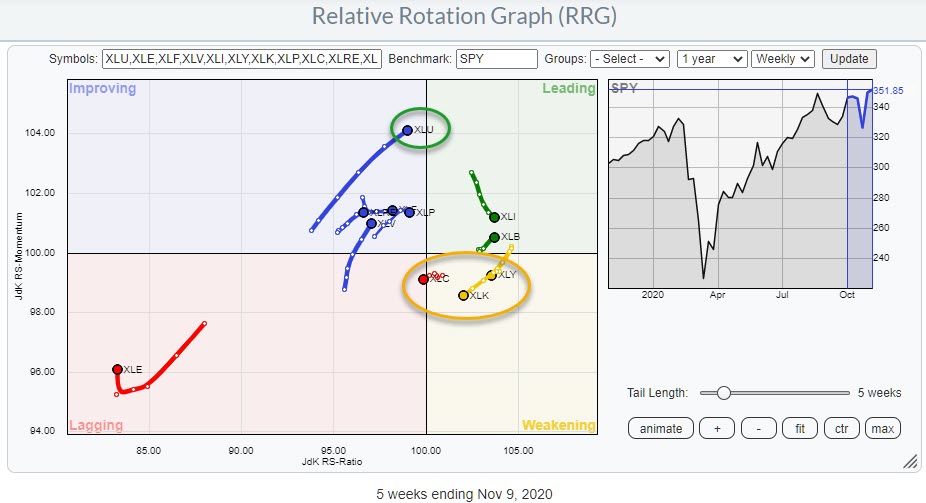
The Relative Rotation Graph for US sectors shows an ongoing rotation out of the three strongest performers in 2020 so far. Technology is inside the weakening quadrant, following a long rotation through leading, and has started to accelerate towards lagging... Read More
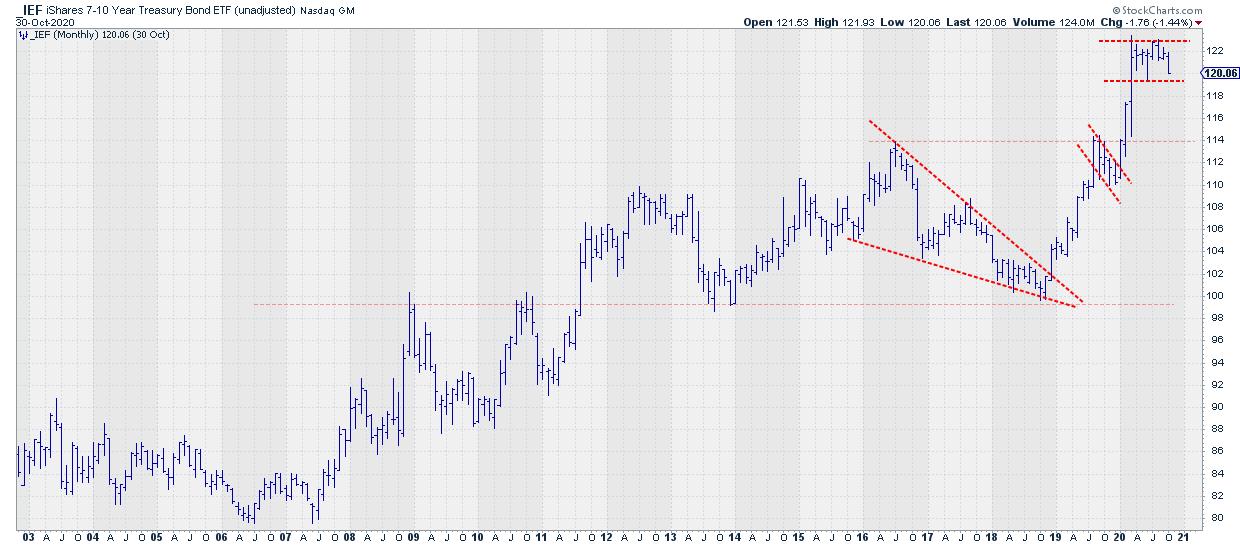
RRG Charts November 03, 2020 at 07:41 PM
In this edition of Sector Spotlight, as it is the first Tuesday of the new month, I take a look at the monthly charts for asset classes and US sectors. Most of the (strong) monthly trends are still intact... Read More
RRG Charts November 03, 2020 at 03:35 PM
On the first Tuesday of every month, I have a segment in Sector Spotlight in which I look at the completed monthly charts for the previous month... Read More