Archived News
Trading Places with Tom Bowley3w ago
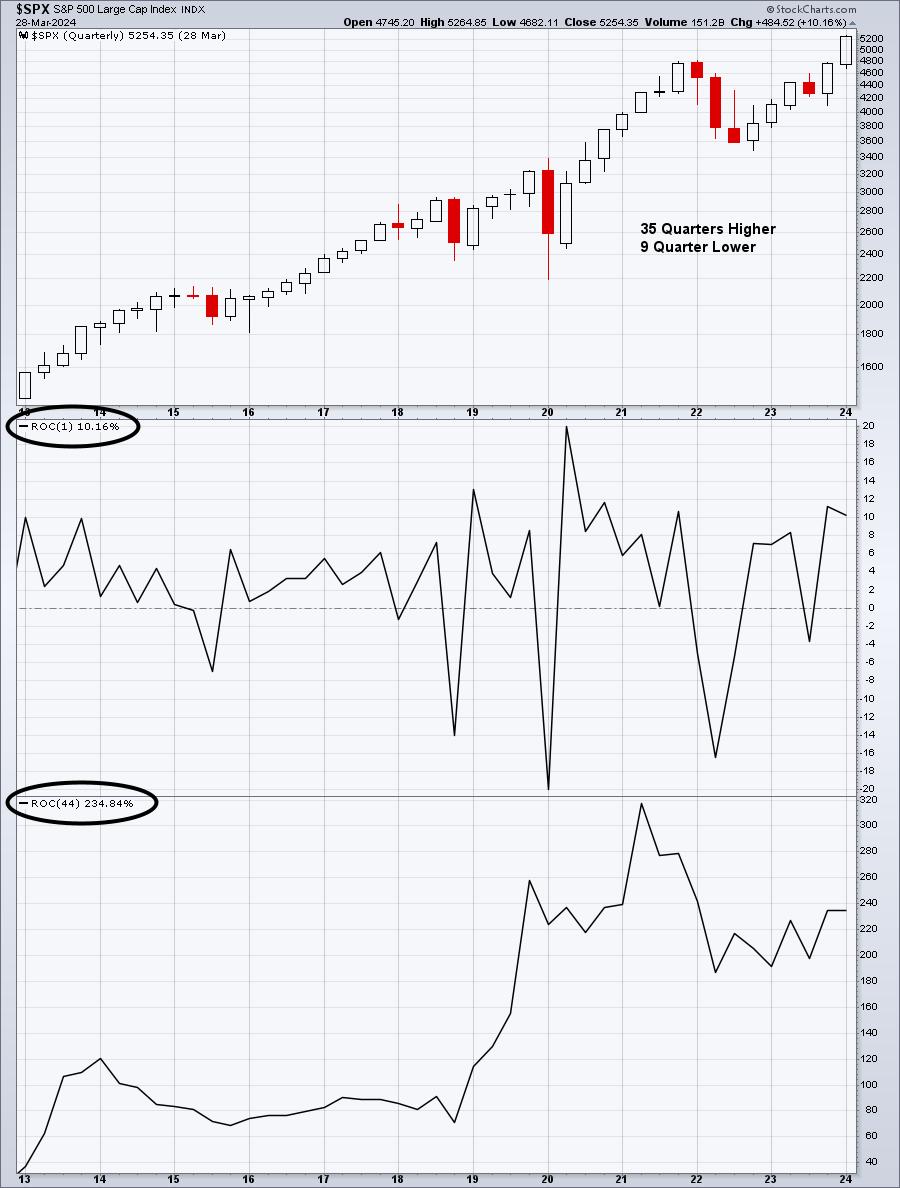
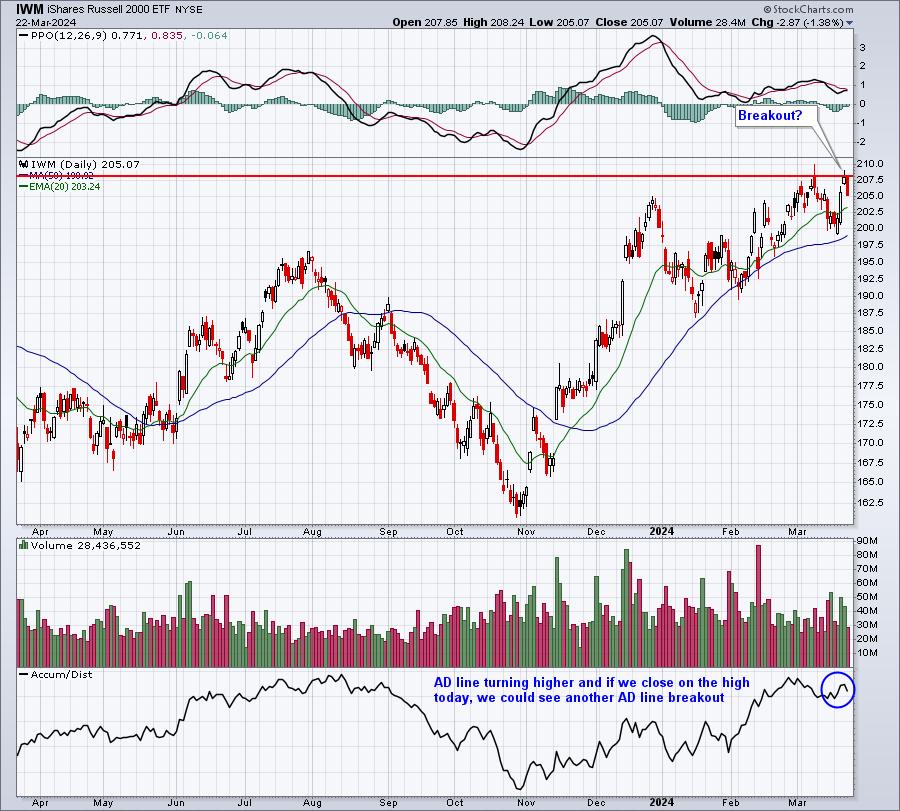
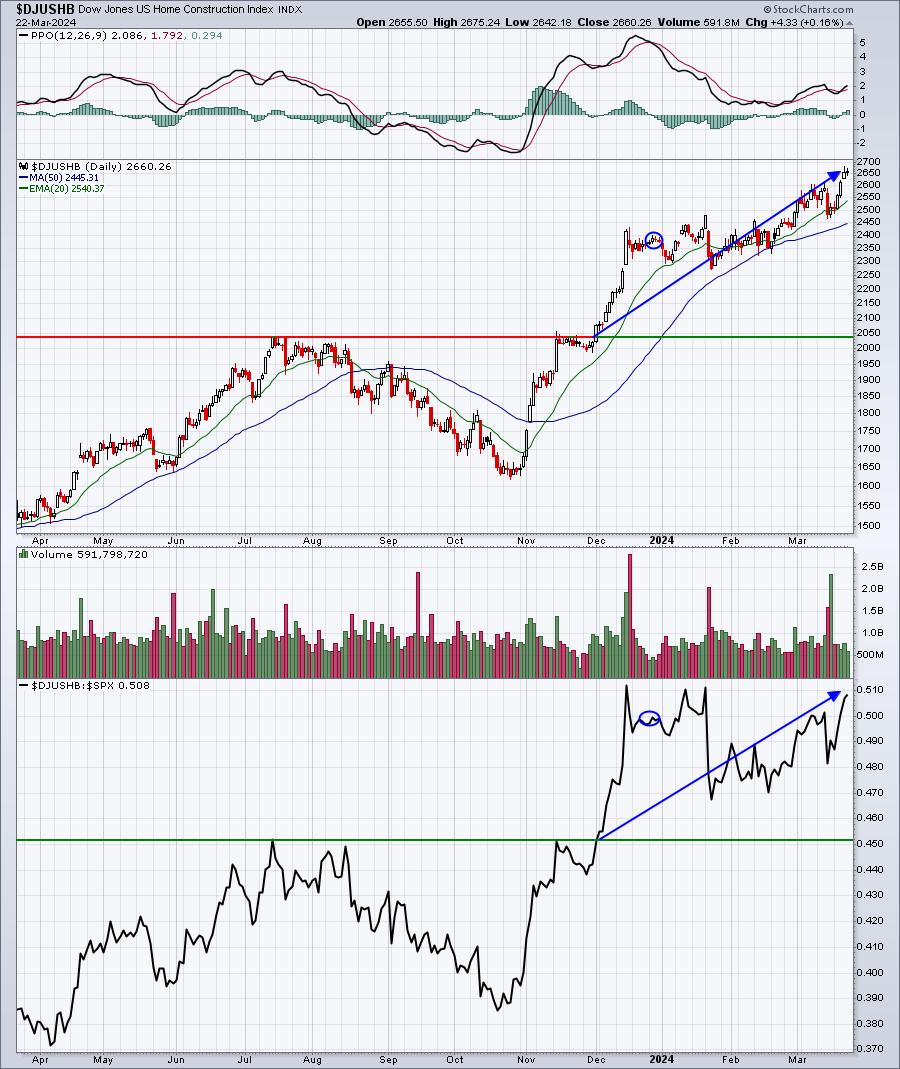
Q1 Ends With A Small Cap Attack! One Small Cap Sector is EXPLODING Higher!
Let's start off by reviewing a quarterly chart of the S&P 500 ($SPX), NASDAQ 100 ($NDX), and Russell 2000 (IWM) since this secular bull market began in early-April 2013 (44 quarters ago): S&P 500: NASDAQ 100: Russell 2000: When you look at these 3 charts, an obvious first conclus Read More
Art's Charts3w ago
Overbought Conditions Reflect Strength and Said Strength Drives Momentum Rotation Strategies
Momentum and trend strategies are off to a roaring start here in 2024. More often than not, these strategies buy leading stocks that appear overbought Read More
The MEM Edge4w ago
Core PCE Data Has Powell Pleased - May Set Tone For Q2
The Fed's preferred gauge of inflation was released today and, according to Fed chief Jerome Powell, "it was good," as there were no ugly surprises Read More
The MEM Edge4w ago
MEM TV: Small Cap STOCKS SHINE! 4 Names to Play the Strength
In this episode of StockCharts TV's The MEM Edge, Mary Ellen reviews what's shaping up in the broader markets after the Fed announced their rate cut plans. She also shares how to use ETFs to shape your investment decisions for the longer term Read More
The Mindful Investor4w ago

Which Magnificent 7 Stock Would You Pick for Q2?
This article represents an exercise I like to call the "Single Stock Portfolio". In this scenario, you can only own one stock in your portfolio for the next three months, and you can pick any one of the following eight stocks Read More
The Final Bar4w ago

Buy Breakout or Fade Divergence on Growth Stocks?
In this edition of StockCharts TV's The Final Bar, Dave presents a mailbag show discussing key technical analysis topics Read More
ChartWatchers4w ago
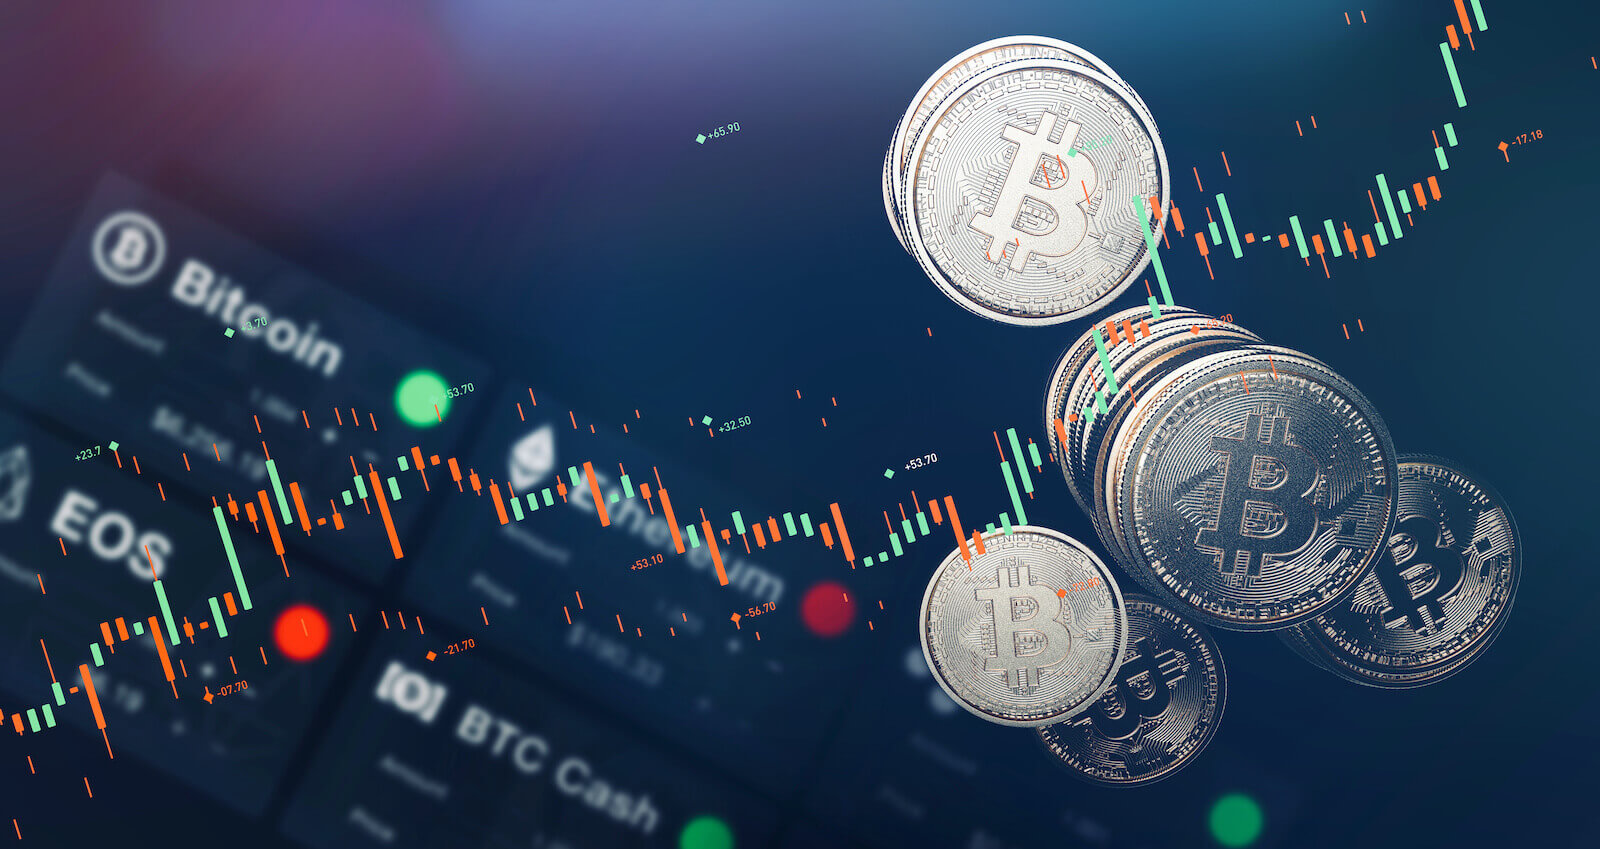
The Fourth Bitcoin Halving Is Upon Us: Is Now the Time to Go Long?
Bitcoin is about to undergo its fourth halving on April 19. For crypto enthusiasts, it's well known that this halving occurs every four years and is a critical event that can significantly alter Bitcoin's market dynamics as it affects the coin's supply mechanism Read More
StockCharts In Focus4w ago
These Breadth Charts PROVE How Strong This Bull Market Is
On this week's edition of StockCharts TV's StockCharts in Focus, Grayson explains the importance of market breadth and shares some of the most crucial charts for understanding what's truly happening beneath the surface of the market Read More
The Final Bar4w ago
How to Analyze Volume Trends on Multiple Time Frames
In this edition of StockCharts TV's The Final Bar, Dave highlights charts breaking above resistance levels, including Gold Shares (GLD), Phillips 66 (PSX), Capital One Fence Corp (COF), Freeport-McMoRan (FCX), and DraftKings (DKNG) Read More
Dancing with the Trend4w ago
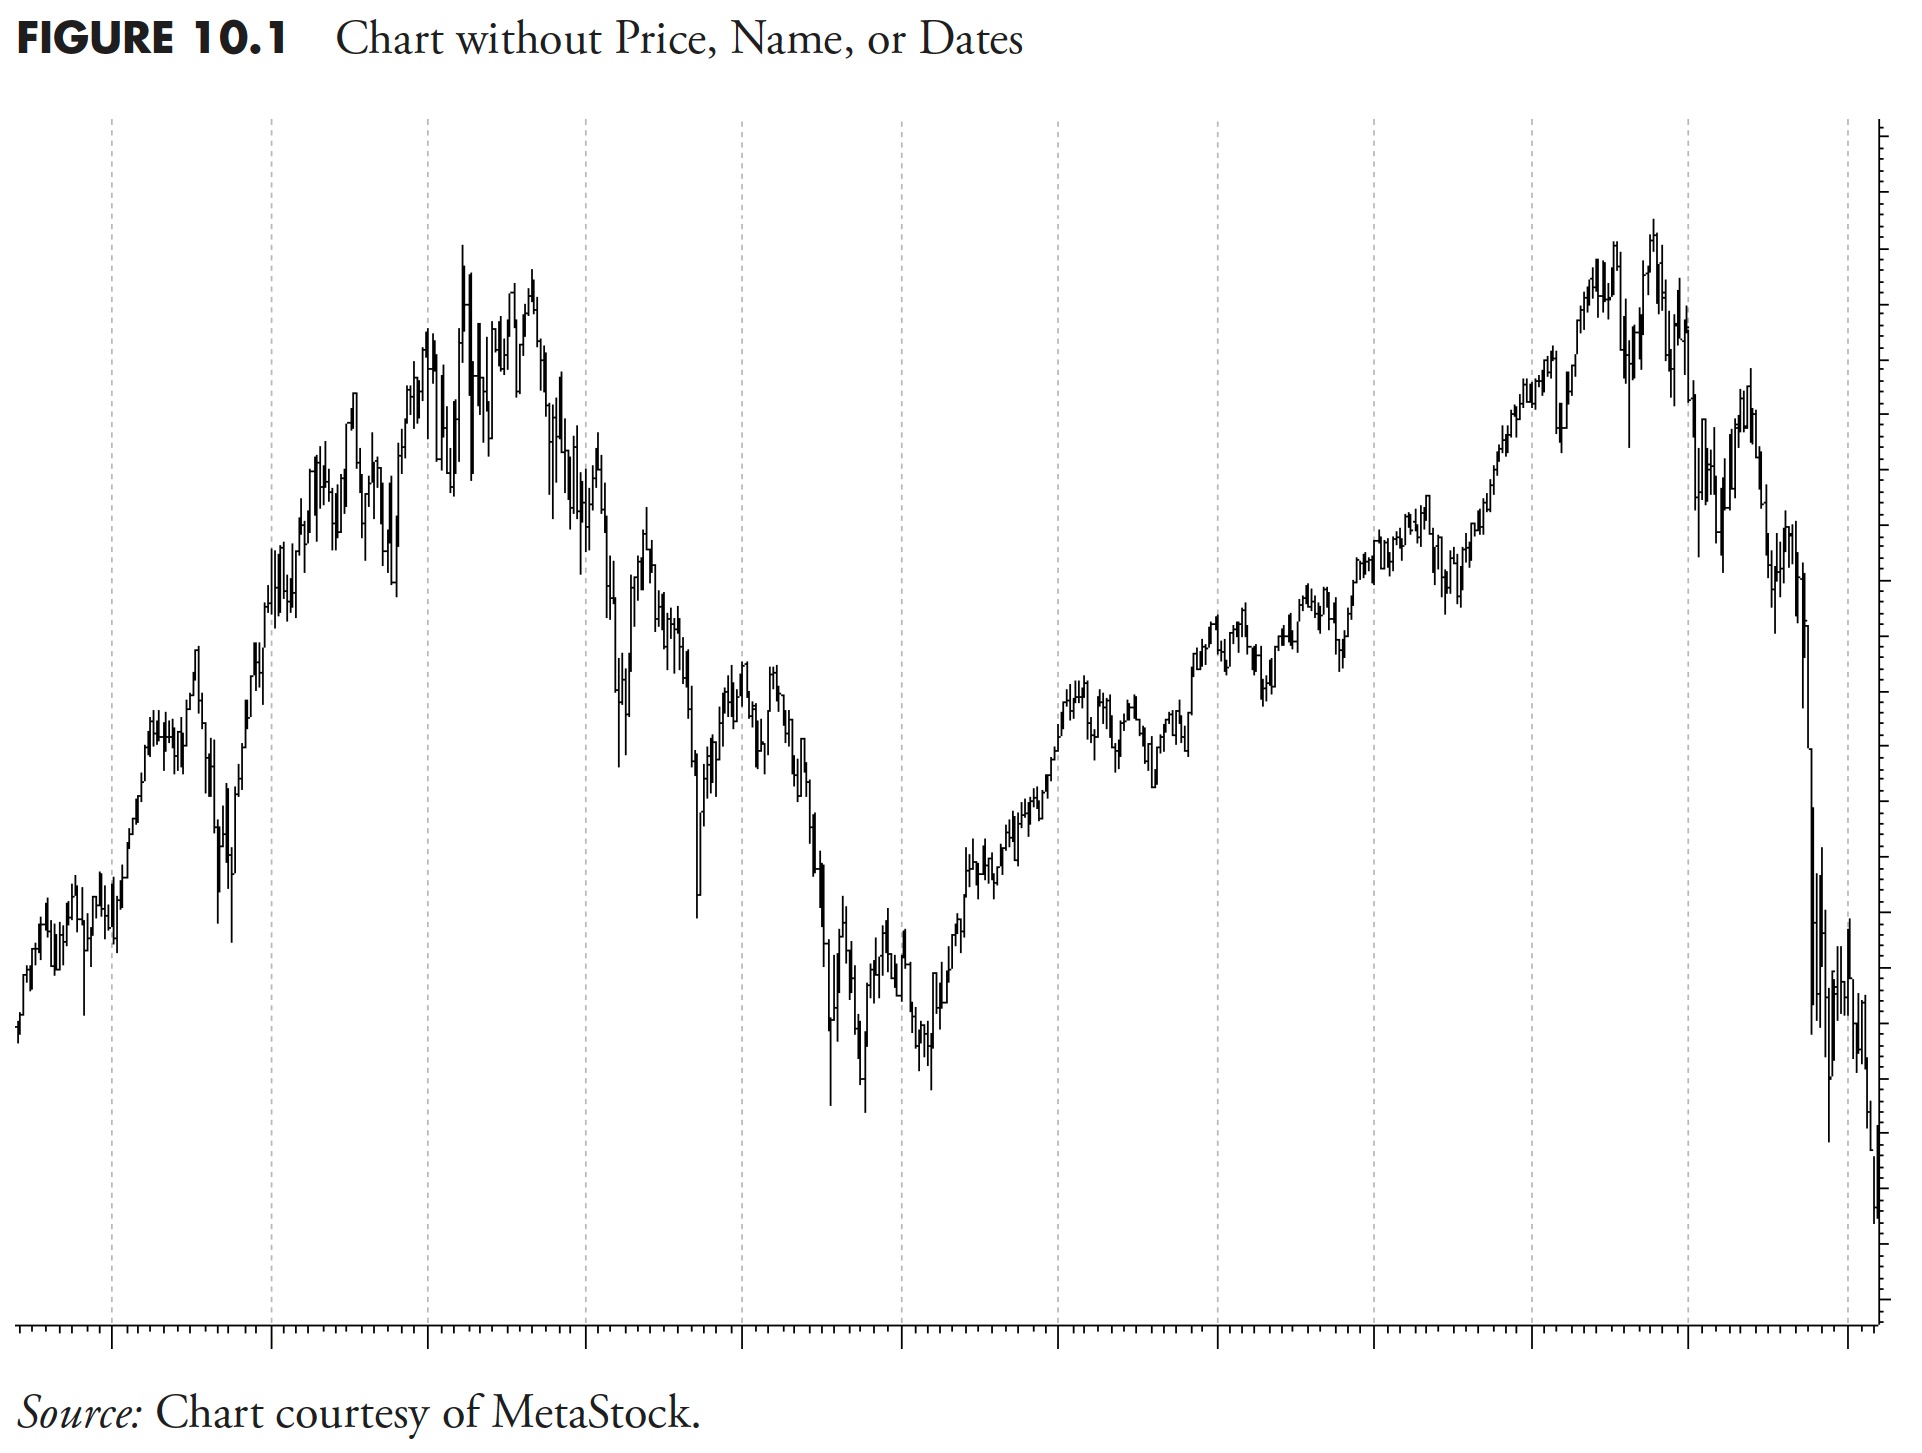
Market Research and Analysis - Part 3: Market Trend Analysis
Note to the reader: This is the fourteenth in a series of articles I'm publishing here taken from my book, "Investing with the Trend." Hopefully, you will find this content useful Read More
DecisionPoint4w ago
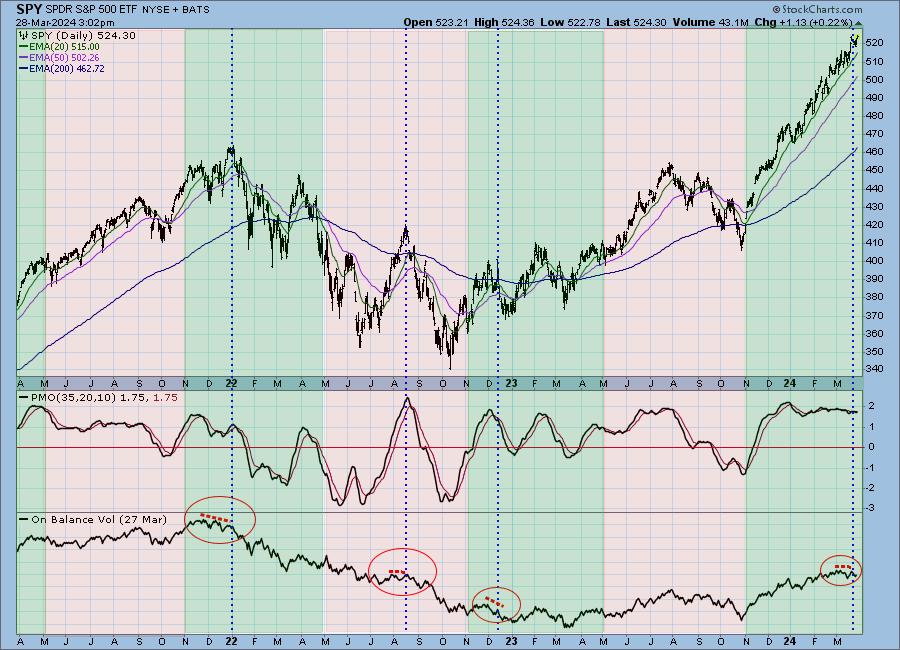
One Month of Positive Seasonality Remaining -- OBV Says, "Maybe Not."
The late Yale Hirsch (Stock Trader's Almanac) has long been known for identifying the six-month periods of positive and negative seasonality in the stock market. The positive period is November through April, and the negative period is May through October Read More
ChartWatchers4w ago

Return of the Meme Stock Frenzy: Is Now the Time to Shift Your Investment Focus?
Today's stock market action uncovered some unusual activity Read More
The Final Bar1mo ago
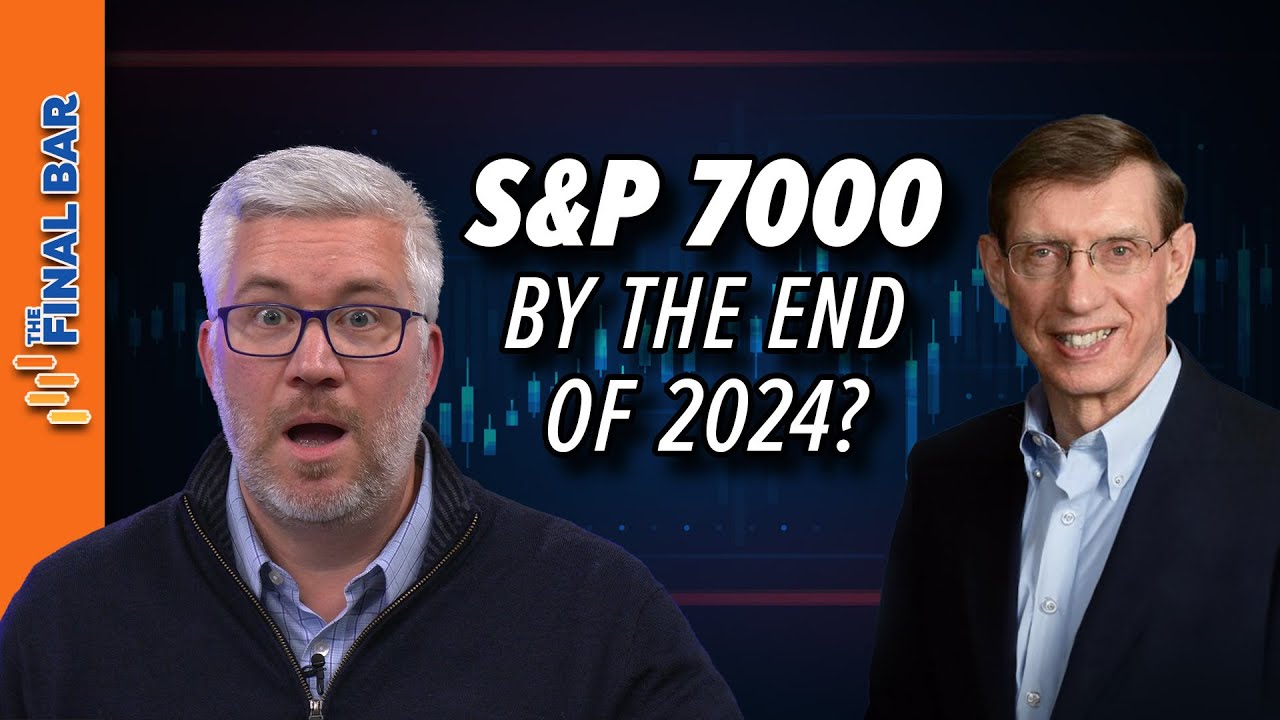
S&P 7000 By End of 2024?
In this edition of StockCharts TV's The Final Bar, guest David Hunter of Contrarian Macro Advisors shares his updated target for the S&P 500, and makes the case for a bullish melt-up phase for stocks, bonds, and gold Read More
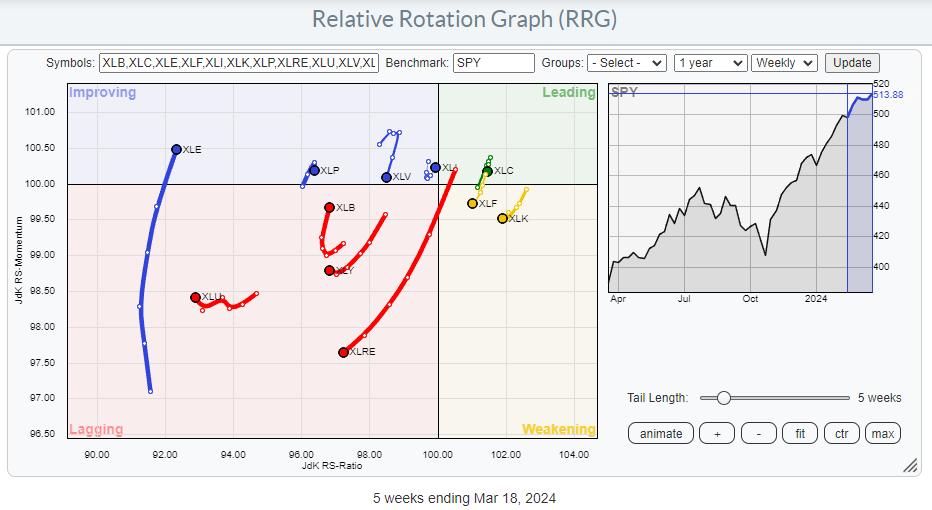
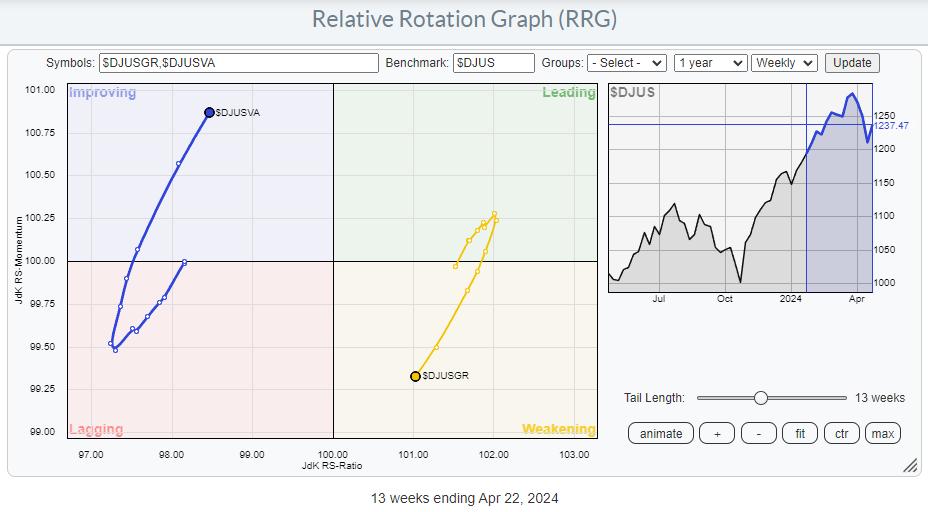
RRG Charts1mo ago
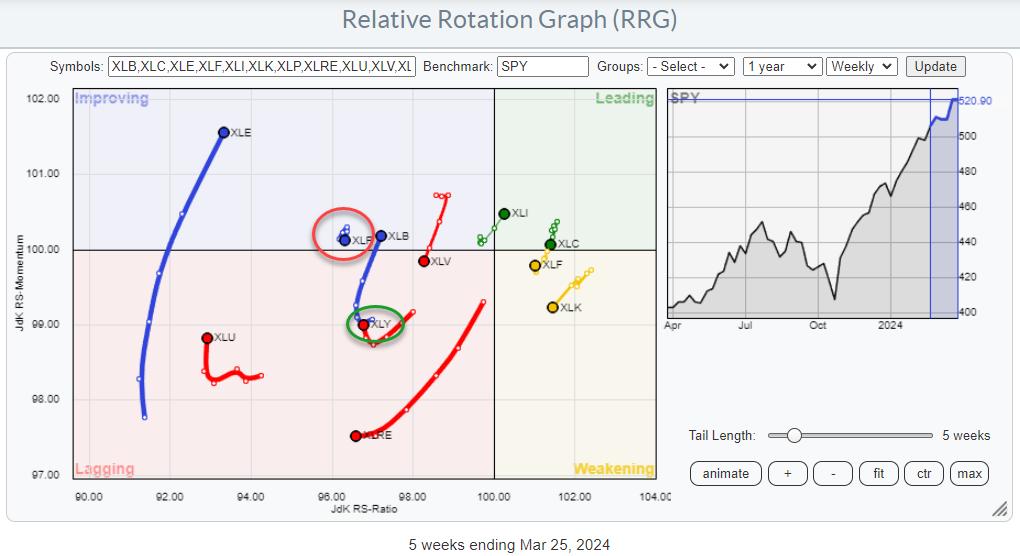
When These Levels Break, The S&P 500 is Going to Explode Higher
Summary The Relative Rotation Graph for US Sectors for this week mainly shows a continuation of the rotations as they were underway last week Read More
Don't Ignore This Chart!1mo ago
KRE's Impending Plunge: What This Emerging Crisis Means
Full disclosure: While there are many ways to view the following, this article will deliberately view the matter from a bearish angle Read More
The Final Bar1mo ago
Three Industrial Stocks With Room to Run!
In this edition of StockCharts TV's The Final Bar, Dave welcomes guest Mary Ellen McGonagle of MEM Investment Research. David compares two stocks in the same industry group with dramatically different chart patterns Read More
DecisionPoint1mo ago
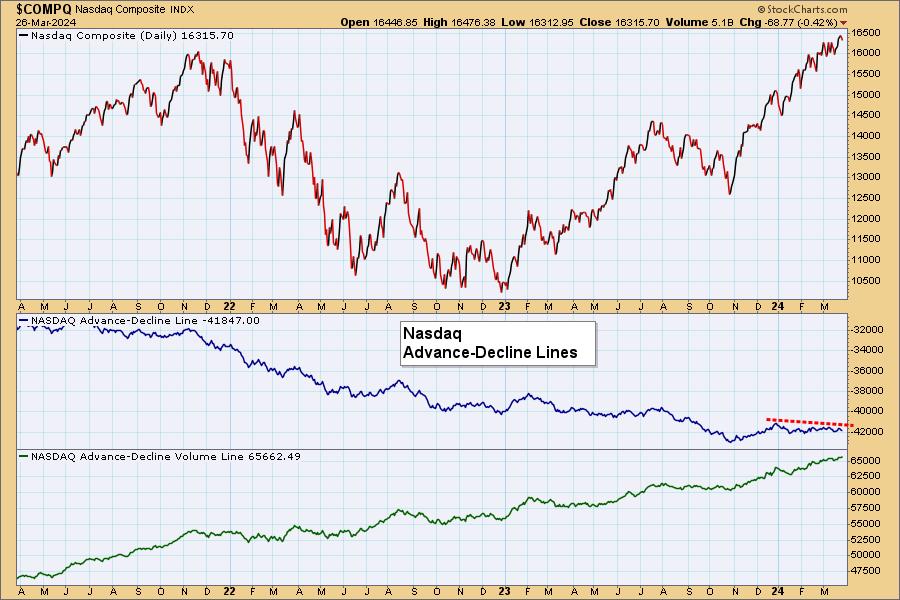
Surprise Negative Divergence on Nasdaq Advance-Decline Line
We were perusing the Advance-Decline Line charts that we have and noticed something that surprised us. The Nasdaq Advance-Decline Line is trending lower while prices continue higher. This is negative divergence we didn't expect to see Read More
Members Only
Martin Pring's Market Roundup1mo ago
Don't Bet on Lower Rates
To paraphrase the late great contrarian Humphrey Neil: When everyone thinks alike, it's usually time to look for a turn in the market Read More
DecisionPoint1mo ago
DP Trading Room: Shake Up at Boeing (BA)
Today Carl and Erin reviewed the Boeing (BA) chart together discussing the technical ramifications of the step down of the CEO and two other board members. We do note that the CEO will finish out the year so problems could continue throughout the year Read More
Analyzing India1mo ago
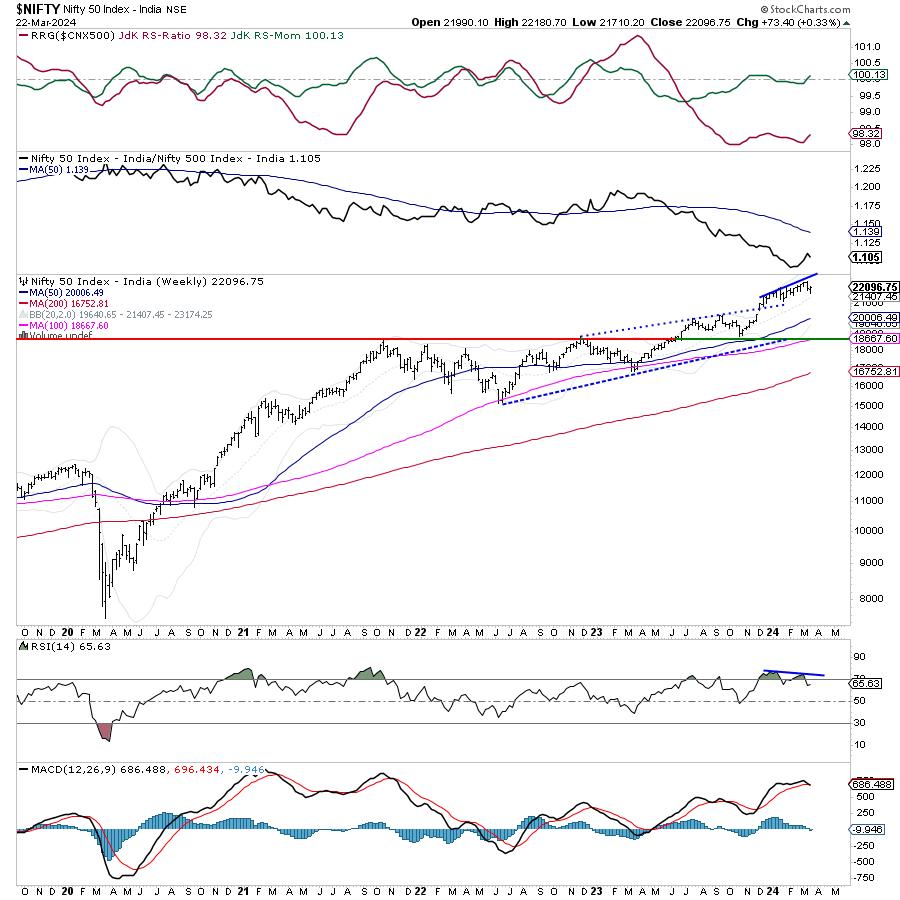
Week Ahead: Short Week May Not See NIFTY Adopting Sustained Directional Bias; Volatility May Return
After a corrective action the week before, the markets continued to wear a tentative look throughout this past week as well Read More
Trading Places with Tom Bowley1mo ago
You Need To Understand NOW What Changed After The Fed Announcement
I've always liked to look at certain points during a bull market or bear market where the character of the market could change based on key fundamental news. We were at one of those points on Wednesday as 2 o'clock approached Read More
Trading Places with Tom Bowley1mo ago
Stocks Are Going UP "With or Without You"
U2 is one of my favorite bands and I can't help but think of their song, "With or Without You", when I look at an S&P 500 chart. This secular bull market is waiting for no one. You're either in it or you're not Read More
Art's Charts1mo ago
An Indicator to Define the Trend and Quantify Momentum
The 200-day SMA is perhaps the most widely used long-term moving average. As its name implies, it is a simple indicator that chartists can use for trend-following and momentum strategies. For trend-following, we just need to know where prices stand relative to the 200-day SMA Read More
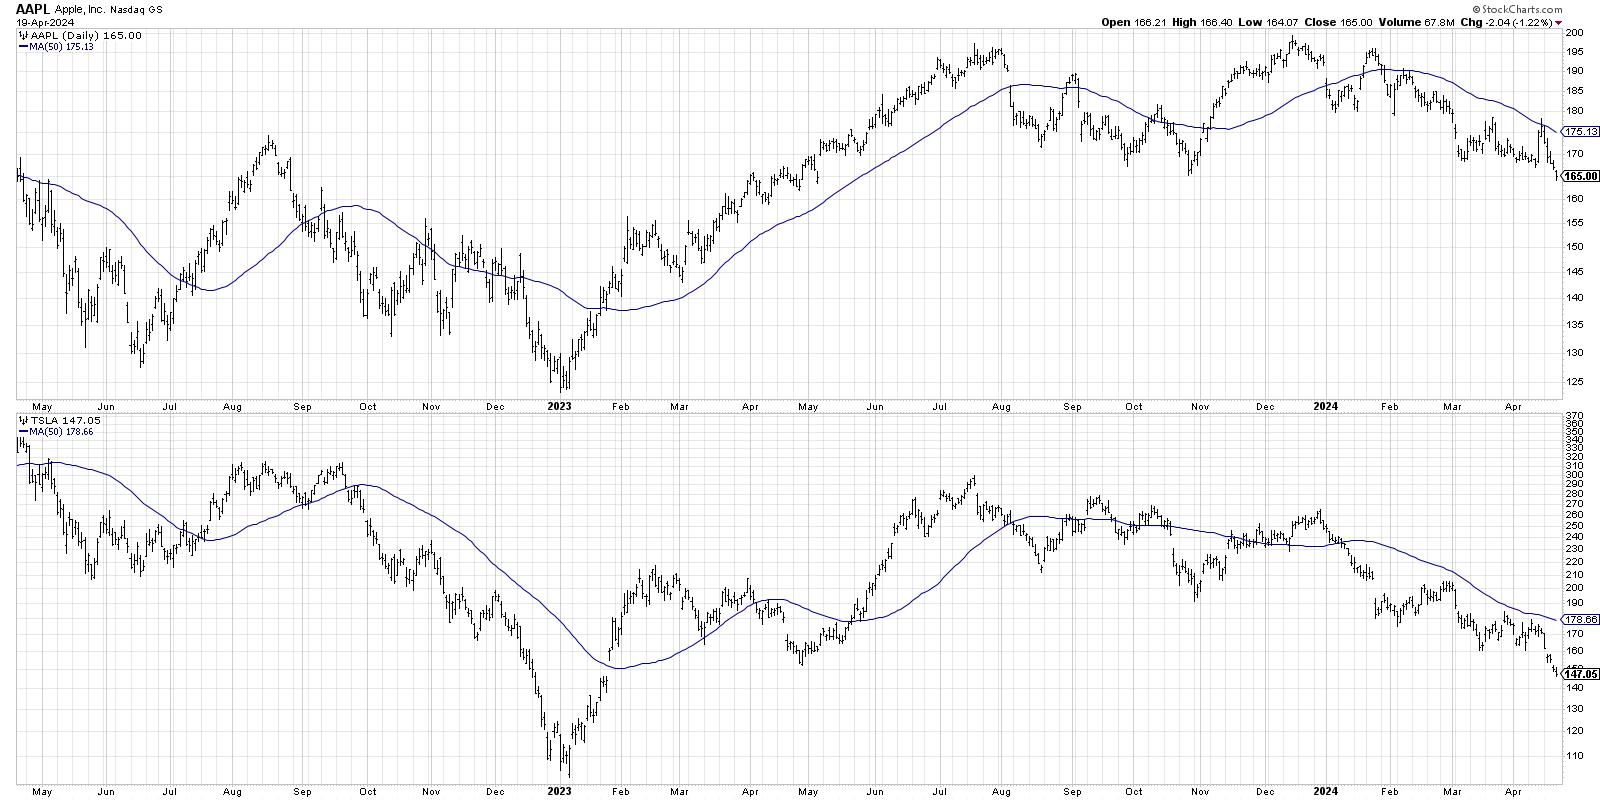
The Mindful Investor1mo ago

Look Out Below! The Bear Case For Apple
The big news for Apple Inc. (AAPL) this week was a huge antitrust case from the US government. While the outcome of that particular situation is uncertain, one reality that has been quite certain is that AAPL is no longer pounding higher like its "magnificent" brethren Read More
ChartWatchers1mo ago
The Stock Market This Week: What This Surging Bull Means
It was an action-packed week in the stock market. The FOMC decided to keep interest rates unchanged, and also indicated there could be three rate cuts this year Read More
The MEM Edge1mo ago

MEM TV: Get In EARLY! These Areas Are Seeing LIFT OFF
In this episode of StockCharts TV's The MEM Edge, Mary Ellen reviews what's shaping up in the broader markets after the Fed announced their rate cut plans. She also shares how to use ETFs to shape your investment decisions for the longer term Read More
The Final Bar1mo ago
The Best Leading Indicator for Stocks
In this edition of StockCharts TV's The Final Bar, Dave brings you another mailbag show! Explore the differences between RSI and Accumulation Distribution for stocks. Compare the benefits of SharpCharts or ACP on StockCharts Read More
Wyckoff Power Charting1mo ago

Energy Heats Up
Crude Oil struck an intraday low on December 13th of 2023, the same day as Fed Chair Powell's notable press conference. This concluded a decline from approximately $95 (at the end of the 3rd quarter) to under $68 (near the end of the 4th quarter) Read More
The Final Bar1mo ago
Post-Fed Rally Ignites Flurry of New Highs
In this edition of StockCharts TV's The Final Bar, Dave comments on AAPL's breakdown on antitrust legislation, the breakouts occurring in the homebuilder space, and how to play names like WDC gapping into key resistance levels Read More
Members Only
Martin Pring's Market Roundup1mo ago
Is China a Basket Case or a Screaming Buy?
By now it's common knowledge that the Chinese property sector is in crisis, foreign investment has slowed, and youth unemployment is at record levels. Should be time to sell Chinese equities, right? After all, we don't know when the other shoe is going to drop Read More
Dancing with the Trend1mo ago
Market Research and Analysis - Part 2: Using Technical Indicators
Note to the reader: This is the thirteenth in a series of articles I'm publishing here taken from my book, "Investing with the Trend." Hopefully, you will find this content useful Read More
Stock Talk with Joe Rabil1mo ago
The Top Candlestick Pattern For Entries
On this week's edition of Stock Talk with Joe Rabil, Joe demonstrates how to use the "Big Green Bar" candlestick pattern. This candlestick provides great confirmation on certain types of entry points, and can also be helpful for exits Read More
The Final Bar1mo ago
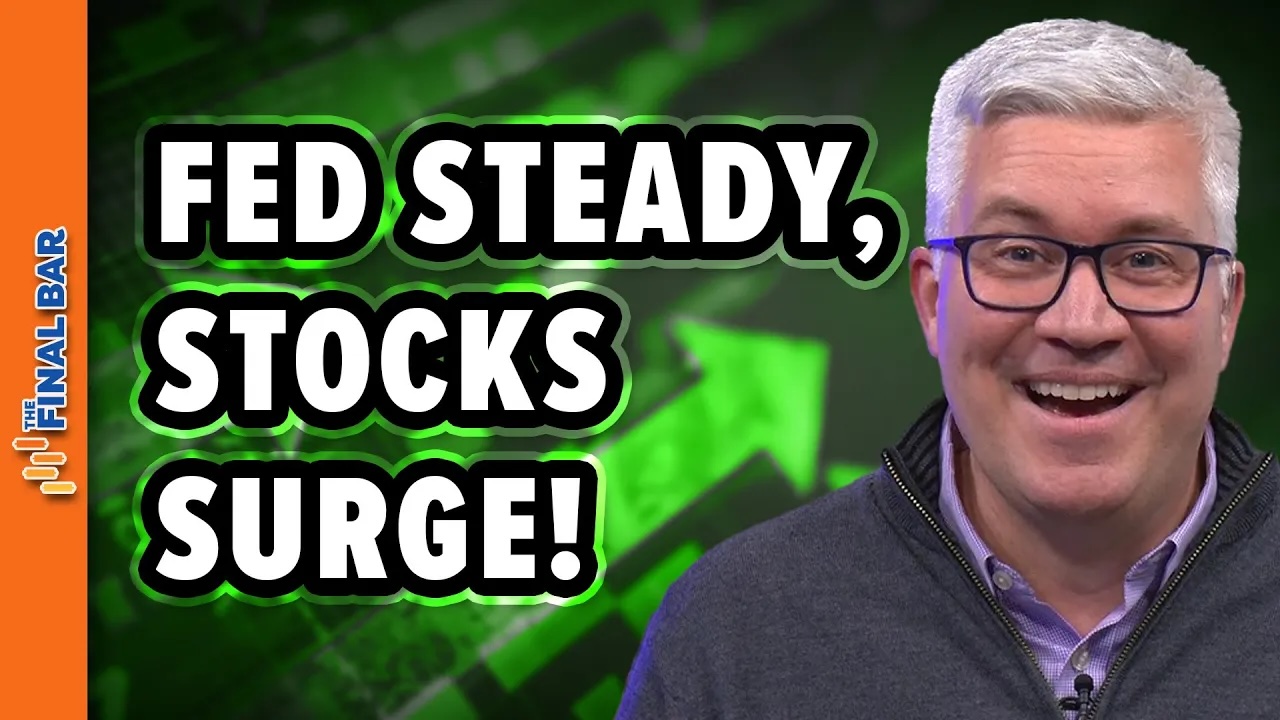
Market Rips Higher After Fed Announcement
In this edition of StockCharts TV's The Final Bar, Dave tracks the S&P 500's first close above the 5200 level as risk assets pop higher following Fed Chair Powell's comments this afternoon Read More
Don't Ignore This Chart!1mo ago
Coinbase Stock Didn't Crash, But the Trade Still Raked in Cash
As a trader, calling market tops (or bottoms) is a difficult and potentially dangerous thing to do. Calling a market top on a fundamentally strong stock during a strong uptrend is probably a foolish thing to do Read More
The Final Bar1mo ago
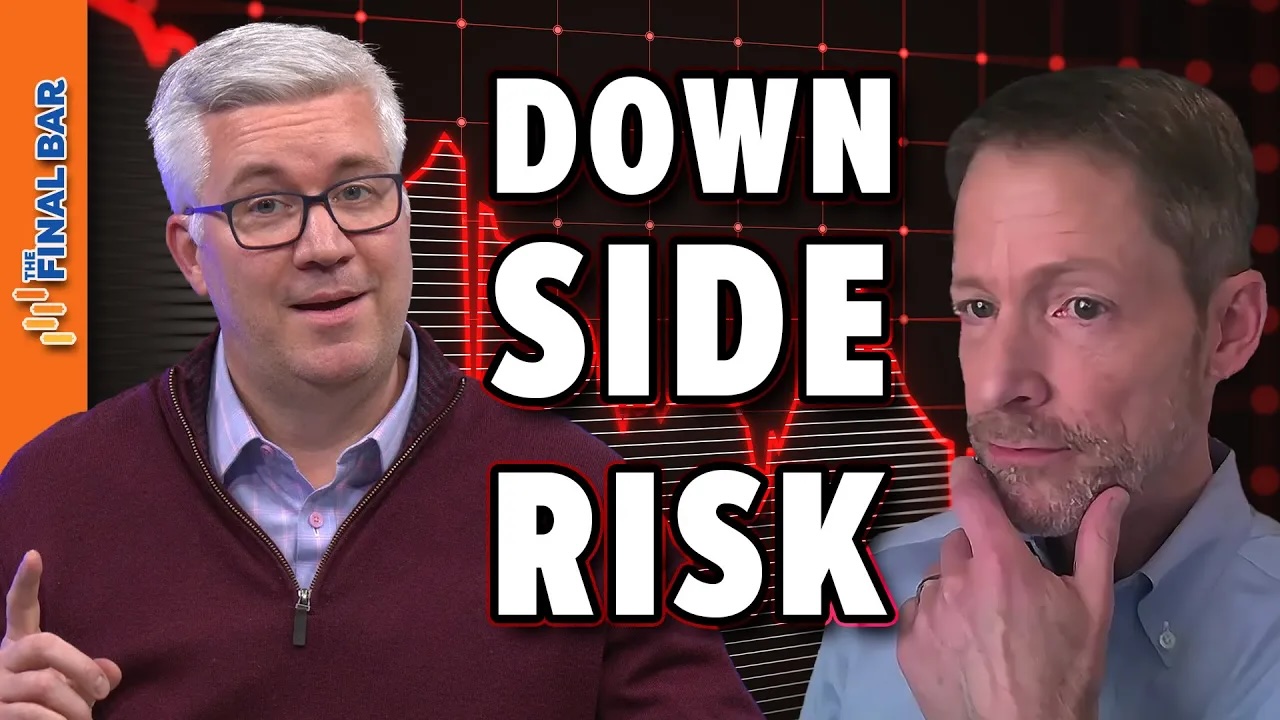
Downside Risk in a Bullish Market
In this edition of StockCharts TV's The Final Bar, Dave welcomes guest Chris Ciovacco of Ciovacco Capital Management Read More
RRG Charts1mo ago
Energy: A Long-Term Turnaround in Relative Strength is Brewing
Energy Improving in Three Time Frames Watching the sector rotation at the start of this week shows a continued improvement for the Energy sector (XLE) Read More
Members Only
Larry Williams Focus On Stocks1mo ago
Larry's "Family Gathering" March 19, 2024 Recording
Fill The Gap by CMT Association1mo ago

The Bond Market is Signaling a Potential Short-Term Trading Opportunity
In our last piece, we presented a long term/secular outlook for intermediate-term Treasuries, where we concluded that the structural break above the secular downtrend from the September 1981 high, coupled with the push above the November 2018 pivot @ 3 Read More
Members Only
Larry Williams Focus On Stocks1mo ago
"Family Gathering" Meeting Today at 2:00 PM Eastern
The Final Bar1mo ago
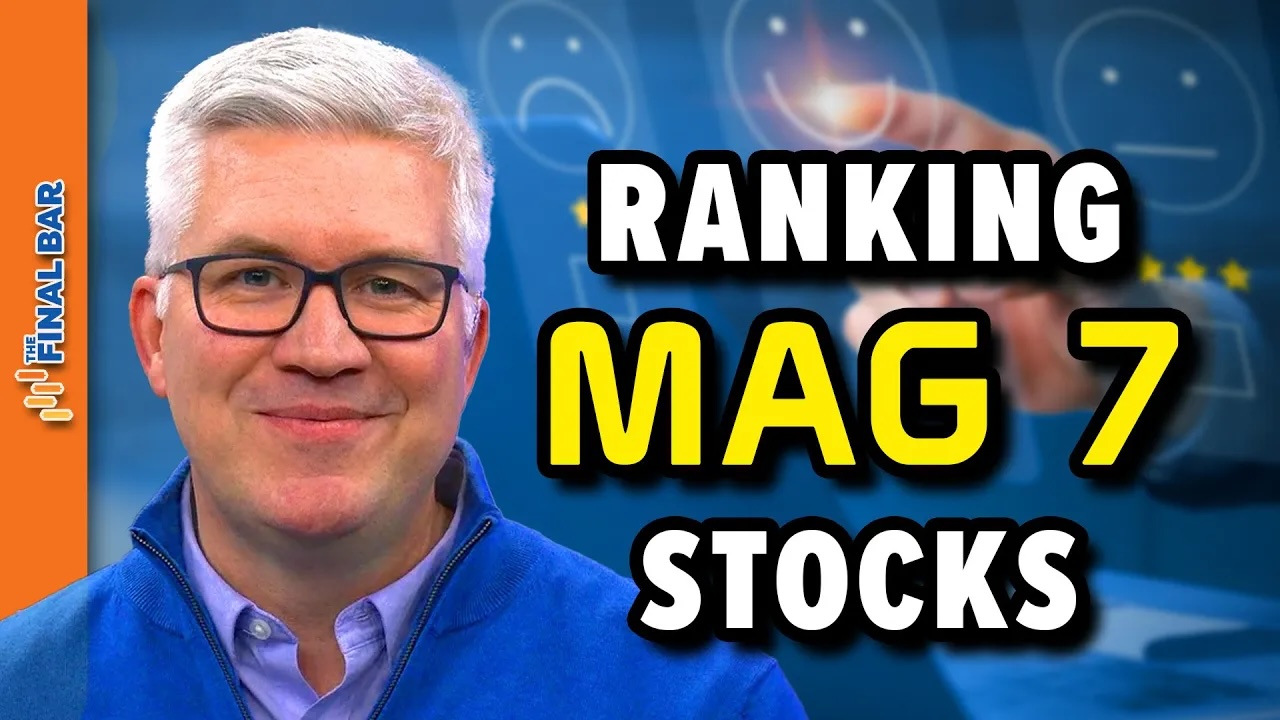
How Would YOU Rank the Magnificent 7 Stocks?
In this edition of StockCharts TV's The Final Bar, Dave recaps the continued leadership rotation from growth to value, with SMCI breaking below $1000 and GOOGL dropping a shooting star candle on Monday's session Read More
Popular Articles
Breakdown in Mega-Cap Growth Confirms Bear Phase

S&P 500 Approaches 100-Day Moving Average: Is Now an Attractive Time to Buy Stocks?

Getting Perspective and Dealing with Volatility
10% Downside Risk For Stocks as Value Takes The Lead

Analyzing the SPY: How to Know When the Pullback is Over
MEM TV: Capitulation Signals for a Market BOTTOM
Get expert technical commentary delivered straight to your inbox! Sign up for our FREE weekly ChartWatchers Newsletter. Learn More
Featured Authors


Featuring a diverse collection of books, DVDs and more, The StockCharts Store has everything you need to learn more about financial charting, improve your trading systems and become a better investor.
Public ChartList Leaders


StockCharts Members unlock complete access to the Stocks & Commodities Magazine archives. Read the latest articles or browse past editions.